
Peer review process
Revised: This Reviewed Preprint has been revised by the authors in response to the previous round of peer review; the eLife assessment and the public reviews have been updated where necessary by the editors and peer reviewers.
Read more about eLife’s peer review process.Editors
- Reviewing EditorJonas ObleserUniversity of Lübeck, Lübeck, Germany
- Senior EditorChristian BüchelUniversity Medical Center Hamburg-Eppendorf, Hamburg, Germany
Reviewer #2 (Public review):
This study investigates how altered neural oscillations may contribute to unilateral spatial neglect (USN) following right-hemisphere stroke. By combining steady-state visual evoked potentials (SSVEPs), phase-amplitude coupling (PAC), transfer entropy (TE), and computational modeling, the authors aim to show that USN arises from disrupted hemispheric synchronization dynamics rather than simply from lesion extent. The integration of empirical EEG data with a mechanistic model is a major strength and offers a valuable new perspective on how frequency-specific neural dynamics relate to clinical symptoms.
The work has several notable strengths. The combination of experimental and modeling approaches is innovative and powerful, and the findings provide a coherent mechanistic framework linking abnormal neural entrainment to attentional deficits. The study also provides concrete compelling evidence supporting the potential for frequency-specific neuromodulatory interventions, which could have translational relevance.
In the revised manuscript, the authors have carefully and comprehensively addressed the concerns raised during the first round of review. In particular, the additional characterization of lesion distribution and volume provides important anatomical context for the electrophysiological findings, while the rationale for the choice of electrodes and clinical correlation analyses is now much clearer. The methodological description has also been improved substantially, including clarification of the SSVEP measure, analysis procedures, and potential confounds related to transfer entropy and volume conduction. In addition, the discussion now provides a more nuanced account of the relationship between stimulus-locked responses and intrinsic oscillatory activity, as well as the potential contribution of alpha lateralization to attentional dysfunction.
Overall, I consider the revised manuscript to provide compelling evidence for an important contribution to our understanding of the neural dynamics underlying spatial neglect. The authors have addressed my previous concerns satisfactorily, and the manuscript now provides a clearer and more balanced account of both the strengths and limitations of the findings. It should serve as a valuable reference for future work on oscillatory mechanisms in stroke and attention.
Author response:
The following is the authors’ response to the original reviews.
Public Reviews:
Reviewer #1 (Public review):
Summary:
Okazaki et al. showed flickering stimuli to patients with unilateral spatial neglect (USN) and measured EEG responses. They compared this with another patient group (post-stroke, but no USN) and healthy controls. The author's rationale was to entrain intrinsic brain rhythms using the flicker of different frequencies (3-30 Hz). Effects found unique to the 9-Hz stimulation condition differentiate USN patients from the other groups, leading them to conclude that USN can be characterized by increased hemispheric alpha asymmetry, driven by a relatively increased response in the intact hemisphere.
Strengths:
This study is principled empirical work that benefits from access to special patient groups of considerable size (about 60 stroke patients in total, and 20 USN). The authors use state-of-the-art established methods to (1) deliver and (2) quantify the responses to the flicker stimulation in the EEG recordings. In addition, they use phase-coupling measures to investigate cross-frequency coupling (here: alphagamma) and a measure of directed connectivity between brain areas, transfer entropy. The results are supported by means of simulations using a coupled oscillators model.
Weaknesses:
In my eyes, the major conceptual weakness of the study is that the authors make the a priori assumption that the flicker stimulation entrains intrinsic brain rhythms, especially alpha (9 Hz). To date, there is no direct (and only equivocal indirect) evidence that alpha rhythms can be entrained with periodic visual stimulation. In the present study, the assumption of alpha entrainment permeates some analytical decisions - where it would be possible to separate stimulus-driven from intrinsic rhythms more strongly than is currently the case, potentially yielding deeper insights into the oscillopathy of USN - and, ultimately, the interpretation of the results. Another potential issue to consider here is the analysis of gamma rhythms in EEG data, absent a control of miniature eye movements, a known problem (YuvalGreenberg et al., 2008, https://doi.org/10.1016/j.neuron.2008.03.027) that may be exacerbated here, given that USN patients could show different auxiliary gaze behaviour.
We thank Reviewer #1 for the careful and constructive evaluation of our study, and for recognizing the strengths of the patient cohort and our combined empirical and computational approach. We also appreciate the reviewer’s concern that our original wording could be read as assuming that flicker stimulation necessarily entrains intrinsic alpha rhythms. In the revised manuscript, we have clarified that our interpretation is based on frequency-specific stimulus-locked responses and model-based inference, rather than on an a priori assumption of entrainment. We have also revised the relevant parts of the Introduction and Discussion to distinguish more clearly between stimulus-locked responses and intrinsic oscillatory dynamics. In addition, we have expanded our discussion of the potential influence of miniature eye movements on gamma-band activity and PAC. These points are addressed in detail in our responses to the Recommendations for the Authors below.
Reviewer #2 (Public review):
This study investigates how altered neural oscillations may contribute to unilateral spatial neglect (USN) following right-hemisphere stroke. By combining steady-state visual evoked potentials (SSVEPs), phase-amplitude coupling (PAC), transfer entropy (TE), and computational modeling, the authors aim to show that USN arises from disrupted hemispheric synchronization dynamics rather than simply from lesion extent. The integration of empirical EEG data with a mechanistic model is a major strength and offers a valuable new perspective on how frequency-specific neural dynamics relate to clinical symptoms.
The work has several notable strengths. The combination of experimental and modeling approaches is innovative and powerful, and the findings provide a coherent mechanistic framework linking abnormal neural entrainment to attentional deficits. The study also provides concrete evidence to support the potential for frequency specific neuromodulatory interventions, which could have translational relevance.
At the same time, there are areas where the evidence could be clarified or contextualized further. The manuscript would benefit from more detailed characterization of lesions, since differences in lesion topography (white vs. gray matter, occipital vs. parietal areas) could greatly improve our understanding of the physiopathology causing unilateral spatial neglect and the altered neural oscillations reported. Methodological choices, such as focusing analyses on occipital electrodes rather than parietal sites, and the potential influence of volume conduction in transfer entropy analyses, also need clearer justification/elaboration. In addition, while the authors report several neural metrics, it is not always clear why SSVEP power was chosen as the primary correlate of clinical severity over other measures. More broadly, the manuscript would be strengthened by clearer definitions of dependent variables and reporting of software and toolboxes used.
Overall, the study makes a significant contribution by demonstrating that USN can be conceptualized as a disorder of disrupted oscillatory dynamics. With some clarifications and expansions, the paper will provide readers with a clearer understanding of both the strengths and the limitations of the evidence, and it will stand as a valuable reference for future work on oscillatory mechanisms in stroke and attention.
We thank Reviewer #2 for the positive assessment of our integrated empirical and computational approach, and for highlighting the potential contribution of our findings to understanding oscillatory mechanisms in USN.
In response to the reviewer’s comments, we have added new supplementary figures showing lesion overlap maps and lesion-volume analyses (Supplementary Figure 1), additional analyses related to electrode selection and SSVEP topography (Supplementary Figure 2), and clinical-correlation analyses of hemispheric imbalance measures (Supplementary Figure 3). We have also revised the manuscript to better contextualize lesion topography and lesion extent, clarify the rationale for the occipital-electrode and clinical-correlation analyses, and provide additional methodological details. These issues are addressed in detail in our point-by-point responses to the Recommendations for the Authors below.
Recommendations for the authors:
Reviewer #1 (Recommendations for the authors):
I found your manuscript well-written and hence easy to follow. Allow me to provide some recommendations to tackle the "weaknesses":
(1) I have mentioned that the entrainment assumption is not warranted based on the current evidence, but I also think that the analysis and interpretation is critically constrained by this. The way the analysis is carried out conflates stimulus-driven and intrinsic brain rhythms, especially in the alpha band. In other words, spectral representations of the EEG data will likely be dominated by natural alpha rhythms, whereas the stimulus-driven signals could be accentuated by a different analysis, time-locked to the stimulation. This is explained in greater detail in Keitel et al. (2019, https://doi.org/10.1523/JNEUROSCI.1633-18.2019). Looking into alpha and stimulus-driven responses separately, without the assumption of entrainment, may actually allow a more complete picture of the impact of USN because the stimulus driven SSVEPs are taken to indicate different cortical processes than alpha (see e.g., Duecker et al., 2021, https://doi.org/10.1523/JNEUROSCI.3134-20.2021, though for gamma). Importantly, this all does not exclude the possibility that alpha rhythms were indeed entrained here, but given the current situation, this should be an outcome of the study rather than an a-priori assumption. I suggest re-framing the manuscript this way.
We agree that the current wording could be read as presuming alpha entrainment. We have revised the framing and terminology to reflect that entrainment is inferred from the 9-Hz–specific stimulation effect and the absence of a corresponding hemispheric bias at rest, with further support from the resonance mechanism demonstrated by our computational model. We also point readers to the Discussion “Alpha frequency-specific hemispheric bias and entrainment in USN patients”, where we explain why the present 9-Hz–specific findings are interpreted in terms of alpha-range resonance/phase alignment and how this is expressed in EEG. We revised the Introduction SSER description (p.4) to:
“SSERs are elicited by rhythmic sensory stimulation and provide a measure of stimulus-locked neural responses. When the stimulation frequency is close to the system’s intrinsic resonance frequency, these responses may include an entrainment component, reflecting the alignment of endogenous oscillations to external input (Pikovsky, Rosenblum, and Kurths 2003; Okazaki et al. 2021)”
We have also revised the Introduction hypothesis statement (p.5) to avoid implying an a priori entrainment assumption, replacing it with:
“We hypothesized that frequency-specific stimulus-locked synchronization dynamics in response to rhythmic stimulation would be selectively disrupted in one hemisphere, resulting in an interhemispheric imbalance in USN.”
Finally, to ensure consistent framing in the Discussion, “Alpha frequency-specific hemispheric bias and entrainment in USN patients”, we have revised the opening sentence (p.20) as follows:
“We observed a hemispheric bias in stimulus-locked responses to flickering stimuli in USN patients in the alpha range, which corresponds to the natural frequency of the visual system (Rosanova et al. 2009; Okazaki et al. 2021).”
(2) Transfer Entropy is used as a measure of directed connectivity and applied to narrow-band filtered EEG signals. Methodological issues have been pointed out with regard to that (Daube et al., 2022, https://doi.org/10.48550/arXiv.2201.02461). Has this been considered?
We thank the reviewer for raising this important methodological concern. As Daube et al. (2022) noted, Transfer Entropy (TE) can be overestimated when applied to narrow-band signals with strong autocorrelation. However, in our analysis, TE was computed not from the narrow-band 9-Hz waveform itself but from its instantaneous amplitude (amplitude envelope), which fluctuates nonperiodically on a slower timescale, thereby reducing the risk of spurious causality driven by sinusoidal autocorrelation. We clarified this explicitly in the Methods, “Transfer entropy (TE)” (p.8) by adding:
“After applying an 8.5–9.5 Hz FIR bandpass filter to the EEG responses to 9-Hz flickering stimuli, we extracted the instantaneous amplitude (amplitude envelope) from the analytic signal using the Hilbert transform. Because this amplitude envelope fluctuates nonperiodically at a slower timescale than the carrier 9-Hz oscillation, it provides a broadband measure of signal dynamics while minimizing the strong autocorrelation inherent in narrow-band periodic signals that can spuriously inflate TE estimates (Daube C et al., 2022).”
We have also clarified the relationship between TE and volume conduction in the same section:
“Importantly, because TE evaluates time-lagged prediction (from Y(t) to X(t+τ)), it is not designed to capture zero-lag common-source correlations (i.e., volume conduction) and therefore characterizes directed, nonzero-lag dependencies rather than an instantaneous coupling.”
Finally, we have added an explicit interpretation emphasizing the direction-specific nature of the effect in the Discussion, “Biased information transfer in USN patients” (p.23):
“This directional asymmetry argues against spurious overestimation of TE due to autocorrelation or volume conduction (Daube, Gross, and Ince 2022), because such pseudo-causal effects would be expected to manifest more symmetrically in both directions. In addition, by computing TE from the amplitude envelope of the 9-Hz activity, we reduced the influence of strong autocorrelation inherent in narrow-band oscillatory signals and thereby minimized the conditions that Daube et al. identified as leading to TE overestimation. Taken together, these points suggest that the observed TE asymmetry is unlikely to be explained solely by methodological artifacts and may reflect a genuine directional imbalance in interregional communication following right-hemisphere damage.”
(3) If a closer control of miniature eye movements is not possible, I suggest removing any gamma analysis, or at least prominently mentioning the caveat that gamma activity may be contaminated by eye movement artifacts.
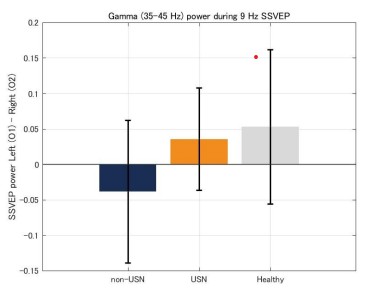
We agree that the contribution of miniature eye movements cannot be completely excluded. However, we consider it unlikely that the hemispheric asymmetry in alpha– gamma PAC reported in this study mainly arises from eye-movement artifacts, for the following reasons. First, SP (saccadic spike potential)-related PAC would require saccade timing to be tightly phase-locked to the 9-Hz cycle. However, SPs are time-locked to saccade onset and typically cluster around 200–300 ms after stimulus onset (Yuval-Greenberg et al., 2008; Keren et al., 2010). Thus, it is unlikely that they would be consistently phase-locked to the 9-Hz cycle (≈111 ms), and even modest temporal jitter would markedly blur PAC. Second, because SPs are brief spike-like transients with broadband high-frequency components, periodic SP contamination would be expected to yield a broadband gamma profile, rather than the relatively narrow band (35–45 Hz) observed here. In addition, we directly compared gamma-band power (35–45 Hz) at O1 and O2 during 9-Hz stimulation using the same gamma range as in the PAC analysis and found no significant hemispheric differences in any group (Author response image 1), arguing against a systematic unilateral increase in gamma power driven by asymmetric saccade behavior. Taken together, these considerations make it difficult to attribute the observed alpha–gamma PAC asymmetry primarily to SPs arising from eye movements. Nonetheless, residual eye-movement artifacts cannot be completely ruled out, and we now explicitly state this limitation in the Discussion, “Limitations” (p. 25) by adding:
“Fourth, the hemispheric bias in alpha–gamma PAC should be interpreted in light of potential contamination from miniature saccades (Yuval-Greenberg, Tomer, Keren, Nelken, & Deouell, 2008). However, several observations make it unlikely that such artifacts are the primary source of the effect. For saccadic spike potentials to account for the PAC under 9-Hz stimulation, they would need to occur in a highly periodic and phase-locked manner relative to the 9-Hz cycle. This scenario is unlikely given the stimulus-locked dynamics of miniature saccades. (i.e., post-stimulus inhibition followed by a rebound around 200–300 ms) (Yuval-Greenberg & Deouell, 2009). Moreover, SP-related contamination would be expected to yield a broadband gamma profile (~20–90 Hz) (Keren, Yuval-Greenberg, & Deouell, 2010; Yuval-Greenberg & Deouell, 2009), rather than the relatively narrow band (35–45 Hz) observed here. In addition, we found that gamma-band power in the 35–45 Hz range did not show any hemispheric difference between O1 and O2 during 9-Hz stimulation (data not shown).”
Author response image 1.
Hemispheric differences in gamma-band (35–45 Hz) power during 9-Hz flicker stimulation. Left (O1) − Right (O2) gamma power did not differ from zero in any group (non-USN: p = 0.45; USN: p = 0.34; healthy: p = 0.35). Error bars represent 2 standard errors of the mean.
(4) Please provide more methodological detail on the resting state recordings. When, how, and under which circumstances were these recorded?
Thank you for pointing this out. We clarified when the resting-state interval was taken in the Methods, “Steady-state visual evoked potential (SSVEP)” (p.7) by adding:
“For the resting-state interval, power was estimated using the same procedure from the ‘off’ interval immediately preceding the 3-Hz flicker block (see Fig. 1)”
(5) Provide power spectra of the EEG data for illustration - ideally for resting state and stimulation conditions. These should allow the reader to visually evaluate the effects of different stimulation frequencies, as well as differences between participant groups.
Figure 2 already presents spectra normalized to the resting-state baseline. To make this explicit for readers, we clarified this point in the Figure 2 caption (p.11) by adding:
“Spectra are normalized to the baseline from the resting-state interval.”
Reviewer #2 (Recommendations for the authors):
(1) The authors indicate L.608 "the precise extent and topography of brain lesions could not be fully homogenized across patients", but the manuscript would highly benefit from any additional detail that could be obtained from characterization of the lesion sites. At minimum, it would be important to indicate for USN and non-USN groups whether lesions predominantly affected white matter or gray matter, and whether occipital versus parietal cortices were involved (e.g., using MRI atlas templates). If this coarse information can be obtained, the authors could test whether any of these anatomical details can distinguish are different between USN and nonUSN patients. This information could help the reader evaluate whether the reported neural asymmetries might be driven by lesion topography rather than purely by oscillatory dynamics.
We understand this comment as raising the important concern that lesion location and lesion volume may differ between the USN and non-USN groups and could contribute to the observed neural asymmetry. We agree that the presence of USN and the alteration of oscillatory dynamics should be interpreted in relation to which regions and networks are damaged, and to what extent. In response to the reviewer’s suggestion, we generated lesion overlap maps based on the available structural images and additionally quantified lesion volume for each patient (replaced Supplementary Figure 1). This analysis confirmed that lesion volume was significantly larger in the USN group than in the non-USN group. Thus, lesion volume is an important anatomical factor to consider when interpreting group differences in USN and neural responses.
At the same time, the present results suggest that lesion volume and coarse lesion topography alone are not sufficient to explain the 9 Hz-specific imbalance in interhemispheric synchrony. Interhemispheric synchrony depends on distributed network functions involving multiple cortical and subcortical regions and their connecting pathways, and similar functional imbalances may arise from different patterns of anatomical damage. Moreover, although the newly added lesion maps confirmed more extensive lesions in the USN group, lesions in both groups predominantly involved the right MCA territory, and lesion extent and location varied across patients. Importantly, the hemispheric asymmetry in neural responses emerged selectively in the 9 Hz condition, whereas SSVEP responses at other frequencies were largely balanced between hemispheres. If lesion volume or coarse lesion topography alone were sufficient to explain the effect, one might expect a more uniform reduction across frequencies or a simpler pattern corresponding to lesion extent.
Accordingly, we do not treat lesion topography and oscillatory dynamics as competing explanations. Instead, we regard them as hierarchically related: anatomical damage alters network components, and this in turn gives rise to a frequency-specific imbalance in synchronization capacity. To clarify this point, we replaced the previous Supplementary Figure 1 with a new figure showing lesion overlap maps and lesion volume information, and revised the Discussion section “Distinct neural responses in non-USN and USN patients” (p. 24) as follows.
“To further characterize the anatomical background of these group differences, we generated lesion overlap maps and quantified lesion volume in the USN and non-USN groups (Supplementary Figure 1). Both groups predominantly showed lesions involving the right MCA territory, but lesion volume was significantly larger in the USN group than in the non-USN group (USN: 72,419 ± 73,778 mm3; non-USN: 11,739 ± 23,907 mm3; Mann–Whitney U = 361.0, p = 1.41 × 10⁻⁵). These anatomical differences indicate that lesion extent is an important factor associated with USN. However, they do not by themselves fully explain the frequency-specific neural effect observed here. Importantly, this frequency specificity coincides with the intrinsic alpha frequency of the visual system. This correspondence suggests that the present finding may not simply arise from lesion location or lesion volume alone, but may instead reflect a more complex mechanism involving selective functional disruption of oscillatory networks. From this perspective, lesion topography and oscillatory dynamics should be regarded not as competing explanations, but as different levels at which the same pathological condition can be understood. The key question is which network components are affected and how their dysfunction gives rise to the frequency-selective hemispheric imbalance in synchronization capacity at 9 Hz. Thus, even if USN and non-USN patients differ in lesion extent and aspects of lesion topography, this does not undermine the present interpretation, but rather highlights the need to examine how anatomical damage relates to frequency-specific network dysfunction.”
We have also referred to our computational account and clarified its implication for the functional mechanism in the same subsection (p. 24):
“Our computational model illustrates a plausible mechanism for such a process. When two coupled oscillators sharing the same intrinsic alpha frequency are connected via asymmetric interhemispheric couplings, the model selectively produces an imbalance in synchrony at the resonant frequency, whereas responses at non-resonant stimulation frequencies remain relatively balanced between hemispheres. This model result suggests that post-lesion asymmetry in interhemispheric coupling may bias alpha-band information processing (e.g. phase-dependent sampling/synchrony) between hemispheres, and may consequently manifest as systematic biases in perceptual and attentional allocation.”
We have also revised the Limitations (p. 25) to acknowledge that the present lesion analyses characterize the distribution and extent of lesions across groups, but do not directly identify which anatomical network disruptions give rise to the 9 Hz-specific imbalance in interhemispheric synchrony.
“Second, although we added lesion overlap maps and quantified lesion volume, these analyses primarily characterize where and how extensively lesions were distributed across the two patient groups. They do not directly identify which anatomical network disruptions give rise to the 9 Hz-specific imbalance in interhemispheric synchrony. Future studies with larger cohorts will be necessary to combine detailed lesion-symptom mapping and assessments of white-matter disconnection with neural synchrony analyses to determine which anatomical network disruptions lead to frequency-specific alterations in oscillatory dynamics after stroke.”
(2) The rationale for focusing on O1 and O2 electrodes should be clarified. Given that neglect is classically associated with parietal dysfunction, one would expect analyses of parietal electrodes to be informative. Could the authors justify their choice, and possibly report whether similar effects were (or were not) observed at parietal sites?
Our primary SSVEP analyses focused on O1 and O2 because flicker stimulation is designed to drive the visual system, and the fundamental SSVEP component is typically maximal over occipital electrodes in healthy participants (Norcia et al., 2015). We also note that hemispheric differences at central and frontal electrodes are already shown in Fig. 4 and described in the Results, demonstrating no significant left–right differences at these sites across any stimulation frequency conditions, including 9 Hz. In addition, we added a supplementary figure showing the scalp topography of the mean fundamental-frequency SSVEP power averaged across all stimulation conditions, which displays the expected occipital maximum and thus a typical SSVEP spatial profile (Supplementary Fig. 2, shown below). We added the rationale and the reference in the Methods, “Steady-state visual evoked potential (SSVEP)” (p. 7) section by adding:
“SSVEP power at the fundamental (stimulated) frequency was then extracted for subsequent analyses. Because the fundamental SSVEP component is typically maximal over occipital electrodes in healthy participants (Norcia et al., 2015), we evaluated occipital electrodes (O1/O2) as primary sites. The scalp topography of the mean fundamental-frequency SSVEP power averaged across stimulation conditions is shown in Supplementary Fig. 2.”
(3) For the mutual information and transfer entropy analyses, the potential influence of volume conduction should be acknowledged. Numerous studies mitigate this issue by applying source reconstruction or connectivity metrics that are insensitive to zerolag correlations. Even if the present study did not use such approaches, the authors should discuss the extent to which volume conduction might confound their results, and ideally provide some justification for why their findings remain valid.
Regarding directed connectivity, our primary analysis uses Transfer Entropy (TE), which evaluates time-lagged prediction and is therefore, by definition, not directly sensitive to zero-lag common-source correlations. Consistently, our key finding is direction-specific (feedforward only), which is not readily explained by symmetric, zero-lag relationships typical of volume conduction. We stated this explicitly in the Methods, “Transfer entropy (TE)” (p.8) by adding:
“Importantly, because TE evaluates time-lagged prediction (from Y(t) to X(t+τ)), it is not designed to capture zero-lag common-source correlations (i.e., volume conduction) and therefore characterizes directed, nonzero-lag dependencies rather than instantaneous coupling.”
We have also clarified the direction-specific logic in the Discussion, “Biased information transfer in USN patients” (p.22):
“This hemispheric difference appeared only in the Feedforward (visual-to-frontal) direction, and no such difference was observed in the Feedback (frontal-to-visual) direction. This directional asymmetry argues against spurious overestimation of TE due to autocorrelation or volume conduction (Daube C, Gross J and Ince RAA, 2022), because such pseudo-causal effects would be expected to manifest more symmetrically in both directions. In addition, by computing TE from the amplitude envelope of the 9-Hz activity, we reduced the influence of strong autocorrelation inherent in narrow-band oscillatory signals and thereby minimized the conditions that Daube et al. identified as leading to TE overestimation. Taken together, these points suggest that the observed TE asymmetry is unlikely to be explained solely by methodological artifacts and may reflect a genuine directional imbalance in interregional communication following right-hemisphere damage.”
(4) In line 579, the authors write 'patients with USN may have larger lesions than those without USN.' It would be useful to clarify whether this claim is supported by the present data (i.e., lesion size comparisons between the two patient groups) or whether it reflects prior literature. If based on the current sample, please provide the corresponding statistical evidence.
This issue has been addressed as part of our response to comment (1), with corresponding revisions made to the Discussion (p. 24), the Limitations (p. 25), and Supplementary Figure 1.
(5) The dependent variable for SSVEP analyses is not clearly described, which makes it difficult to understand the results (e.g., L.214, L285-297). It seems that for all stimulation conditions, one value was extracted (and then compared between O1 and O2 electrodes), but is that the amplitude at the stimulated frequency (e.g., for a visual stimulation at f Hz, comparing the amplitude of the power spectrum at f Hz between O1 and O2)?
Thank you for pointing this out. We clarified that the dependent variable for the SSVEP analyses was the power at the fundamental (stimulated) frequency f for each condition. We added this explicitly to the Methods, “Statistical analysis” (p.9):
“The SSVEP power at the fundamental (stimulated) frequency f was analyzed for each condition as the dependent variable...”
(6) Most analyses are described relatively precisely mathematically, but no toolbox or software is mentioned. Were they implemented using custom scripts? If toolboxes/software was used, the authors should indicate which ones and their versions, and add references. For instance, I might be wrong, but I guess the linear mixed model analyses were not performed using custom code. MATLAB is mentioned for the simulations, but no version is indicated. This is particularly important for reproducibility since the authors did not provide direct access to their scripts.
The EEG preprocessing, PAC, and cluster-based permutation tests were conducted using the FieldTrip toolbox integrated with custom MATLAB scripts. Linear mixed-effects models were performed in SPSS. We added this information to the Methods, “Preprocessing” (p.7):
“All EEG analyses were implemented using custom scripts in MATLAB (MathWorks, Natick, MA, USA) and the FieldTrip toolbox (Oostenveld R et al., 2011).”
We have also specified the tools used for the linear mixed-effects models and the cluster-based permutation test in the Methods, “Statistical analysis” (p.9):
“…using a linear mixed model in SPSS… a cluster-based permutation test (Maris E and Oostenveld R, 2007) using FieldTrip.”
(7) The rationale for correlating BIT scores specifically with SSVEP power (rather than with the hemispheric imbalance measure, or with MI/TE results) is not clearly articulated. The results section highlights several neural metrics (SSVEP imbalance, PAC, TE), so it would strengthen the manuscript if the authors explained why SSVEP power was prioritized for correlation analyses. Is there a theoretical or empirical reason for this choice?
While our main group-level results demonstrate a frequency-selective hemispheric imbalance, Fig. 5 suggests that the lesioned and intact hemispheres are not necessarily simple mirror images of each other and can show distinct response profiles. Therefore, to clarify which hemisphere’s response changes are associated with symptom severity, we assessed correlations with BIT using hemisphere-specific SSVEP power. At the same time, it is also informative to directly test the extent to which symptom severity covaries with hemispheric imbalance metrics (i.e., left–right differences in SSVEP, PAC, and TE). Accordingly, in the revised manuscript we additionally analyzed correlations between BIT and hemispheric imbalance measures of SSVEP, PAC, and TE, and report these results in the Supplementary Information (Supplementary Fig. 3). We added this clarification to the Results, “Correlation between SSVEP power and USN severity” (p.17):
“In addition, correlations between BIT and the hemispheric imbalance of SSVEP power are provided in the Supplementary Information (Supplementary Fig. 3A). We also report, as additional exploratory analyses, correlations between BIT and hemispheric imbalance measures derived from PAC and TE (Supplementary Fig. 3B and 3C). None of these correlations reached statistical significance after correction, although the feedforward TE imbalance to the left frontal region showed a marginal uncorrected association with BIT score (r = -0.51, uncorrected p = 0.05).”
We have also added the following statement to the Discussion, “Biased information transfer in USN patients” (p.23).
“This interpretation is also consistent with the trend-level correlation shown in Supplementary Figure 3C. Although the correlation did not survive correction for multiple comparisons, patients with a stronger feedforward TE bias toward the left frontal region tended to show higher BIT scores. This observation raises the possibility that asymmetric information transfer from the right visual cortex to the intact left frontal cortex may contribute to compensatory network reorganization associated with milder neglect symptoms.”
(8) The discussion could be enriched by considering whether the observed abnormal alpha-band entrainment relates to the well-known alpha-lateralization phenomenon in spatial attention. In healthy individuals, covert attentional orienting is typically accompanied by lateralized modulations of alpha power (increased ipsilateral, decreased contralateral). Could the asymmetric alpha entrainment reported here be interpreted as a pathological exaggeration of this mechanism, thereby linking the electrophysiological findings more directly to attentional orientation deficits in neglect?
We thank the reviewer for raising this valuable point. To integrate our results with the alpha-lateralization literature, we added a new paragraph to the Discussion, “Local hemispheric bias of alpha-band entrainment and attentional dysfunction in USN patients” (p.22) subsection
“Clinically, USN presents as neglect of the left visual field and is generally thought to reflect a relative dominance of rightward orienting. Because alpha power is often interpreted as reflecting functional inhibition (Worden et al. 2000; Kelly et al. 2006; Foxe and Snyder 2011), classic alpha-power lateralization associated with rightward orienting would typically predict increased alpha power over the right hemisphere and decreased alpha power over the left. However, in our data, right-hemisphere alpha power during stimulation was comparable to that of controls, whereas the intact left hemisphere exhibited stronger stimulus-locked synchronization (SSVEP) and enhanced alpha–gamma coupling. Thus, the present findings do not appear to reflect a simple amplification of tonic spatial alpha-power lateralization. Rather, they suggest a dynamic, temporally selective form of alpha-mediated inhibition that organizes the timing of local excitability. From this perspective, alpha-power lateralization and stimulus-locked entrainment may reflect related but distinct aspects of alpha-based inhibitory control, with the former regulating spatial gating and the latter regulating the timing of sensory processing (Jensen and Mazaheri 2010).
Moreover, such a timing-based bias may arise even in the absence of explicit flicker. Visual input is continuously sampled under the influence of intrinsic alpha activity, and perceptual sensitivity fluctuates with the phase of ongoing oscillations (Romei et al. 2008; Iemi et al. 2017; VanRullen 2016). As a consequence, processing is relatively facilitated when incoming events coincide with high-excitability phases and relatively suppressed otherwise (Busch, Dubois, and VanRullen 2009; Mathewson et al. 2010). Thus, a hemispheric bias in alpha-band synchronization capacity could bias the timing with which sensory input is sampled across the two hemispheres, even without explicit rhythmic stimulation. This view is also consistent with the possibility that the bias is less apparent during eyes-closed rest with minimal visual input, yet becomes behaviorally expressed in everyday settings where continuous input is sampled in a phase-dependent manner (Landau and Fries 2012; VanRullen 2016). Overall, a hemispheric bias in synchronization capacity within the alpha range likely disrupts the temporally coordinated sampling of visual input required for balanced spatial attention, contributing to the attentional deficits observed in USN.”
(9) All reported t-tests should include degrees of freedom (df). This is essential for transparency and allows readers to assess the robustness of the statistical results.
We added the degrees of freedom for the t-tests reported in the Results, “Hemispheric imbalance of TE” (p.15):



