
Peer review process
Revised: This Reviewed Preprint has been revised by the authors in response to the previous round of peer review; the eLife assessment and the public reviews have been updated where necessary by the editors and peer reviewers.
Read more about eLife’s peer review process.Editors
- Reviewing EditorCaleb KemereRice University, Houston, United States of America
- Senior EditorLaura ColginUniversity of Texas at Austin, Austin, United States of America
Reviewer #1 (Public review):
Wang, Zhou et al. investigated coordination between prefrontal cortex (PFC), and hippocampus (Hp), during reward delivery via analyzing beta oscillation. Beta oscillations are associated with various cognitive functions but their role in coordinating brain networks during learning is still not thoroughly studied. Authors focused on the changes in power, peak frequencies and coherence of beta oscillations in two regions when rats learn a spatial task thru days. Contradicting with authors hypothesis, beta oscillations in those two regions during reward delivery were not coupled in spectral or temporal aspects. They were, however, able to show reverse changes in beta oscillations in PFC and Hp as the animal's performance got better. Authors were also able to show a small subset of cell population in PFC that are modulated by both beta oscillations in PFC and sharp wave ripples in Hp. A similarly modulated cell population was not observed in Hp. These results are valuable in pointing out distinct periods during a spatial task when two regions modulate their activity independent from each other.
Authors made a detailed analysis of the data to support their conclusions. Few more points of discussion would clarify the results of the paper.
(1) One of the big conclusions of the paper is how the beta burst power is changing after learning the task (Figure 3). Authors have also showed in Figure 6-1, how the SWR power and rate are changing thru the training days. Did they observe a change in coordination of Beta bursts and SWR between the days, which would also reflect how experience changes the coordination?
(2) Authors have shown in detail the opposite relationship between Beta phase locking and SWR modulation in Hippocampus in Figure 7I. This might require a different analysis, but is it possible to make a discussion on predicting a cell firing in a SWR after it fires in a beta burst.
Other than these two points, authors have addressed previous comments and made a convincing analysis of their data.
Reviewer #2 (Public review):
Using electrophysiological recordings in freely moving rats during a spatial navigation task, this study investigated the role of beta oscillations in the hippocampal-prefrontal network. Through a set of appropriate analyses-including oscillation-oscillation coupling, oscillation-spike modulation, and behavioral dependant measurements-the study presents convincing evidence for uncoupled beta activity between the two regions. These findings offer important insights into the network mechanisms of spatial navigation and may have significant implications for related neurological disorders.
Comments on revised version.
The authors have carried out additional analyses and made corresponding revisions to the manuscript in response to the earlier review comments, which have made the conclusions more convincing. However, please note that the last question about coexistence of beta and SWR has not been fully answered. Please supplement your response to address this point completely.
Reviewer #3 (Public review):
This paper explored the role of beta rhythms in the context of spatial learning and mPFC-hippocampal dynamics. The authors characterized mPFC and hippocampal beta oscillations, examining how their coordination and their spectral profiles related to learning and prefrontal neuronal firing. Rats performed two tasks, a Y-maze and F-maze, with the F-maze task being more cognitively demanding. Across learning, prefrontal beta oscillation power increased while beta frequency decreased. In contrast, hippocampal beta power and beta frequency decreased. This was particularly for the well-performed and well-learned Y-maze paradigm. The authors identified the timing of beta oscillations, revealing an interesting shift in beta burst timing relative to reward entry as learning progressed. They also discovered an interesting population of prefrontal neurons that were tuned to both prefrontal beta and hippocampal sharp-wave ripple events, revealing a spectrum of SWR-excited and SWR-inhibited neurons that were differentially phase locked to prefrontal beta rhythms.
Author response:
The following is the authors’ response to the original reviews.
Reviewer #1 (Public review):
Wang, Zhou et al. investigated coordination between the prefrontal cortex (PFC) and the hippocampus (Hp), during reward delivery, by analyzing beta oscillations. Beta oscillations are associated with various cognitive functions, but their role in coordinating brain networks during learning is still not thoroughly understood. The authors focused on the changes in power, peak frequencies, and coherence of beta oscillations in two regions when rats learn a spatial task over days. Inconsistent with the authors' hypothesis, beta oscillations in those two regions during reward delivery were not coupled in spectral or temporal aspects. They were, however, able to show reverse changes in beta oscillations in PFC and Hp as the animal's performance got better. The authors were also able to show a small subset of cell populations in PFC that are modulated by both beta oscillations in PFC and sharp wave ripples in Hp. A similarly modulated cell population was not observed in Hp. These results are valuable in pointing out distinct periods during a spatial task when two regions modulate their activity independently from each other.
The authors included a detailed analysis of the data to support their conclusions. However, some clarifications would help their presentation, as well as help readers to have a clear understanding.
(1) The crucial time point of the analysis is the goal entry. However, it needs a better explanation in the methods or in figures of what a goal entry in their behavioral task means.
We appreciate Reviewer 1 pointing out this shortcoming and will clarify the description in the revised manuscript. Each goal is located at the end of the arm, and is equipped with a reward delivery unit. The unit has an infrared sensor. The rat breaks the infrared beam when it enters the goal. Figures 1 and 2 have been updated to clearly indicate the time of goal entry. The main text and methods have been updated with the explanation.
(2) Regarding Figure 2, the authors have mentioned in the methods that PFC tetrodes have targeted both hemispheres. It might be trivial, but a supplementary graph or a paragraph about differences or similarities between contralateral and ipsilateral tetrodes to Hp might help readers.
We appreciate this suggestion, which has led to an interesting finding. The coherence and burst coordination were similar for ipsi- and contralateral PFC and hippocampus. Interestingly, we found PFC beta activity was more coherent within each PFC hemisphere compared with across hemispheres. This was observed for coherence and burst time. This suggests there is hemispheric localization of beta oscillations. These results are shown in Fig. 2-1.
(3) The authors have looked at changes in burst properties over days of training. For the coincidence of beta bursts between PFC and Hp, is there a change in the coincidence of bursts depending on the day or performance of the animal?
This is now reported in Fig. 3-3. After quantifying the proportion of independent and coincident bursts as function of experiment day or performance, we found a decrease in the proportion of coincident bursts within CA1, which was specific to the well-performed Y-maze.
(4) Regarding the changes in performance through days as well as variance of the beta burst frequency variance (Figures 3C and 4C); was there a change in the number of the beta bursts as animals learn the task, which might affect variance indirectly?
The difference in the burst count across days did not explain the results. We performed a permutation test (Fig. 4-4), where we randomly shuffled the day identity to control for the count difference across days. The change in variance remains significant.
(5) In the behavioral task, within a session, animals needed to alternate between two wells, but the central arm (1) was in the same location. Did the authors alternate the location of well number 1 between days to different arms? It is possible that having well number 1 in the same location through days might have an effect on beta bursts, as they would get more rewards in well number 1?
The central arm remained the same across days since we needed the animals to learn the alternation task. In our experience, the animal needs a few days to learn the alternation rule when we switch the central arm location. For this experiment, we were interested in the initial learning process, and we kept the central arm constant. Switching the central arm location is a great suggestion for a follow-up experiment where we can understand the effects of reward contingency change on beta bursts.
(6) The animals did not increase their performance in the F maze as much as they increased it in the Y maze. It would be more helpful to see a comparison between mazes in Figure 5 in terms of beta burst timing. It seems like in Y maze, unrewarded trials have earlier beta bursts in Y maze compared to F maze. Also, is there a difference in beta burst frequencies of rewarded and unrewarded trials?
We performed the analysis and found burst timing was similar between the two mazes (Fig. 4-2). Bursts on rewarded trials occurred later than those on unrewarded trials (Fig. 4). Interestingly, PFC bursts on rewarded trials were lower in frequency compared with unrewarded trials. CA1 bursts during rewarded and unrewarded trials had similar frequencies (Fig. 4-3).
(7) For individual cell analysis, the authors recorded from Hp and the behavioral task involved spatial learning. It would be helpful to readers if authors mention about place field properties of the cells they have recorded from. It is known that reward cells firing near reward locations have a higher rate to participate in a sharp wave ripple. Factoring in the place field properties of the cells into the analysis might give a clearer picture of the lack of modulation of HP cells by beta and sharp wave ripples.
As recommended, we quantified the mean speed, mean distance to goal locations, and spatial information for CA1 cells (Fig. 7 J-L). We found SWR reactivated CA1 cells had higher speed and were spiking further away from the goals compared with non-reactivated CA1 cells. This is consistent with prior work that shows SWR-associated reactivation in dorsal CA1 can correspond to trajectories taken as the animal moves towards goals. In intermediate CA1, the content of reactivations is biased toward place representations closer to goals (Jin et al., 2024). CA1 cells with or without phase locking to beta oscillations had similar spatial firing properties.
Reviewer #1 (Recommendations for the authors):
(1) Please make a figure representing what the goal entry means in Figure 1.
We have updated Fig. 1 to clearly show the definition of goal entry. We also edited the main text and methods to better explain the definition of goal entry.
(2) For Figure 1-1, please either change the contrast of the pictures, or define the lesioned areas, as it is a bit difficult to see the lesioned parts, especially in PFC.
We have increased the contrast for Fig. 1-1 for the histology to better show the lesions.
(3) For Figure 1-2, is it possible to show a beta burst from Hp?
Yes, we provided two examples of beta bursts from the hippocampus alongside burst examples from PFC in Fig. 1-2.
(4) Is it possible to make a supplementary table showing the number of tetrodes recorded from each animal per day, plus the number of isolated single cells?
Yes, we have included tetrode counts in Table 1-2 and cell counts in Tables 5-2 to 5-4.
Reviewer #2 (Public review):
(1) When presenting the power spectra for the representative example (Figure 1), it would be appropriate to display a broader frequency band-including delta, theta, and gamma (up to ~100 Hz), rather than only the beta band.
We agree the extended frequency range provides a better overview of the spectral characteristics during the goal period. We have now included example spectrograms up to 100 Hz to show the spectral content for a wider range of frequencies (Fig. 1-2). Further, we have included additional analyses to compare the spectral characteristics between periods when the animal was moving on the maze or immobile at the goal, for frequencies up to 100 Hz (Fig. 1C-H, Fig. 1-3 and 1-4). We used both Welch’s periodogram (Fig. 1-3) and continuous wavelet transform (Fig. 1-4) to demonstrate our findings on beta oscillations in both regions are robust and consistent.
What was the rat's locomotor state (e.g., running speed) after entering the reward location, during which the LFPs were recorded?
Because goal entry is defined as the time the animals break the infrared beam at the goal (response to Reviewer 1), the rat would have come to a stop. We have added the time-aligned speed profile to the spectra and raw data examples in the manuscript (Fig. 1B, Fig. 1-4, Fig. 2A, and Fig. 6A). In addition, we added the quantification of the animal’s speed at the time of beta bursts (Fig. 3-1, Fig. 4-1) and SWRs (Fig. 6-1D).
If the rats stopped at the goal but still consumed the reward (i.e., exhibited very low running speed), theta rhythms might still occasionally occur, and sharp-wave ripples (SWRs) could be observed during rest.
We typically find low theta power in the hippocampus after the animal reaches the goal location and as it consumes reward. Reviewer 2 is correct about occasional theta power at the goal. To compare differences in LFP characteristics between maze running and goal locations, we added additional analyses in Fig. 1-3 and 1-4. We did find SWRs during goal periods (Fig. 6) and we quantified SWR properties in an additional analysis in Fig. 6-1.
Do beta bursts also occur during navigation prior to goal entry? It would be beneficial to display these rhythmic activities continuously across both the navigation and goal entry phases.
We did not find consistent beta bursts in PFC or CA1 on approach to goal entry. We generated an additional goal entry-aligned spectrogram, and quantification (Fig. 1-4) to show that beta oscillations in both regions increased after goal entry. This was also supported by the Welch’s periodogram method (Fig. 1C-H, Fig. 1-3). Beta oscillations in the hippocampus during locomotion or exploration have been reported (Ahmed & Mehta, 2012; Berke et al., 2008; França et al., 2014; França et al., 2021; Iwasaki et al., 2021; Lansink et al., 2016; Rangel et al., 2015).
Additionally, given that the hippocampal theta rhythm is typically around 7-8 Hz, while a peak at approximately 15-16 Hz is visible in the power spectra in Figure 1C, the authors should clarify whether the 22 Hz beta activity represents a genuine oscillation rather than a harmonic of the theta rhythm.
We performed further spectral analysis comparing times when the animal is moving on the maze with times when the animal is immobile at the goal (Fig. 1-3 and 1-4). The results point to the beta frequency oscillations in both regions are unlikely to be harmonics of theta. The beta frequency bands in the spectrogram are independent of the theta band. We were initially concerned about the possibility that the 22 Hz power in CA1 may be a harmonic rather than a standalone oscillation band. If these are harmonics of theta, we should expect to find coincident theta at the time of bursts in the beta frequency. In Fig. 1B, Fig. 1-5, and Fig. 2A, we show examples of the raw LFP traces from CA1. Here, the detected bursts are not accompanied by visible theta-frequency activity. For PFC, we do not always see persistent theta-frequency oscillations like CA1. In PFC, we found beta bursts were frequent and visually identifiable when examining the LFP. We provided examples of the PFC LFP (Fig. 1B, Fig. 1-5, and Fig. 2A). In these cases, we see clear beta frequency oscillations lasting several cycles and these are not accompanied by any visible oscillations in the theta frequency in the LFP trace.
(2) The authors claim that beta activity is independent between CA1 and PFC, based on the low coherence between these regions. However, it is challenging to discern beta-specific coherence in CA1; instead, coherence appears elevated across a broader frequency band (Figure 2 and Figure 2-1D). An alternative explanation could be that the uncoupled beta between CA1 and PFC results from low local beta coherence within CA1 itself.
This is a legitimate concern, and we used three methods to characterize coherence and coordination between the two regions. First, we calculated coherence for tetrode pairs for times when the animal was at goals (Fig. 2B), which provides a general estimation of coherence across frequencies but lack any temporal resolution. Second, we calculated burst-aligned coherence (Fig. 2-2), which provides temporal resolution relative to the burst, but the multi-taper method is constrained by the time-frequency resolution trade-off. Third, we quantified the timing between the burst peaks (Fig. 2D), which described the timing differences but the peaks for the bursts may not be symmetric. Each method has its own caveats, but we drew our conclusion from the combination of results from these three analyses, which pointed to similar conclusions.
Reviewer 2 is correct in pointing out the uniformly high coherence within CA1 across the frequency range we examined. When we inspected the raw LFP across multiple tetrodes in CA1, they were similar to each other (Fig. 2A). This likely reflects the uniformity in the LFP across recording sites in CA1, which is what we saw with coherence values across the frequency range (Fig. 2B). We found that CA1 coherence between tetrode pairs within CA1 was statistically higher than tetrode pairs in PFC across the frequency range (Fig. 2B and C), thus our results are unlikely to be explained by low beta coherence within CA1 itself. The burst-aligned coherence using a multi-taper method also supports this. The coherence values within CA1 at the time of CA1 bursts were ~0.8-0.9.
(3) In Figure 2-1E-F, visual inspection of the box plots reveals minimal differences between PFC-Ind and PFC-Coin/CA1-Coin conditions, despite reported statistical significance. It may be necessary to verify whether the significance arises from a large sample size.
We will include the sample sizes in Table 2-1. We repeated the analyses based on average values per day for each animal (Fig. 2-2 E-F). The pattern of significance remains consistent.
(4) In Figure 3 and Figure 4, although differences in power and frequency appear to change significantly across days, these changes are not easily discernible by visual inspection. It is worth considering whether these variations are related to increased task familiarity over days, potentially accompanied by higher running speeds.
We agree with Reviewer 2 that familiarity increases across days, and the animal is likely running faster. The analysis for Fig. 3 (previously Fig. 3 and 4) includes only data from periods when the animal was at the goal and was not moving. We added a supplemental figure (Fig. 3-1), which shows that the speed of the animal was below 0.5 cm/s at the time of the analyzed bursts. We used linear mixed-effects models to quantify the relationship between power, frequency and day or behavioral quintile, which accounts for repeated measurements across animals.
(5) The stronger spiking modulation by local beta oscillations shown in Figure 6 could also be interpreted in the context of uncoupled beta between CA1 and PFC. In this analysis, only spikes occurring during beta bursts should be included, rather than all spikes within a trial. The authors should verify the dataset used and consider including a representative example illustrating beta modulation of single-unit spiking.
We agree with Reviewer 2 that the stronger modulation to local beta is another piece of evidence indicating uncoupled beta between the two regions. We appreciate this suggestion and have revised Fig. 5 (previously Fig. 6) to include examples illustrating beta modulation for single units. These are spike-phase raster and histograms. We want to clarify that in the revised manuscript, the spikes were only from periods when the animal was at the goal location (5 s after entry) and did not include the running period between goals. Although beta power fluctuates in bursts, our data show there are ongoing beta oscillations throughout this period (Fig. 1-3 and Fig. 1-4), which prompted us to examine the entire period.
(6) As observed in Figure 7D, CA1 beta bursts continue to occur even after 2.5 seconds following goal entry, when SWRs begin to emerge. Do these oscillations alternate over time, or do they coexist with some form of cross-frequency coupling?
This is a very helpful suggestion and led to some interesting findings. We performed two additional analyses: 1) burst/SWR cross-correlation on a shorter timescale and 2) SWR-aligned spectrogram for the beta frequency range. PFC beta burst timing and power appear to be anti-correlated with SWRs detected in CA1 (Fig. 6G and K). In contrast CA1 beta bursts were more likely to occur with SWRs (Fig. 6H and L). These results suggest there is temporal coordination between ongoing beta oscillations in PFC and SWRs in the hippocampus during waking. Cortical beta oscillations are reduced during hippocampal SWRs, perhaps to support the transient switch in global cortical states that accompanies SWRs.
To examine potential cross-frequency coupling between SWRs and beta oscillations, we computed the mean SWR band power (150-250).
Reviewer #3 (Public review):
Summary:
This paper explored the role of beta rhythms in the context of spatial learning and mPFC-hippocampal dynamics. The authors characterized mPFC and hippocampal beta oscillations, examining how their coordination and their spectral profiles related to learning and prefrontal neuronal firing. Rats performed two tasks, a Y-maze and an F-maze, with the F-maze task being more cognitively demanding. Across learning, prefrontal beta oscillation power increased while beta frequency decreased. In contrast, hippocampal beta power and beta frequency decreased. This was particularly the case for the well-performed and well-learned Y-maze paradigm. The authors identified the timing of beta oscillations, revealing an interesting shift in beta burst timing relative to reward entry as learning progressed. They also discovered an interesting population of prefrontal neurons that were tuned to both prefrontal beta and hippocampal sharp-wave ripple events, revealing a spectrum of SWR-excited and SWR-inhibited neurons that were differentially phase locked to prefrontal beta rhythms.
In sum, the authors set out to examine how beta rhythms and their coordination were related to learning and goal occupancy. The authors identified a set of learning and goal-related correlates at the level of LFP and spike-LFP interactions, but did not report on spike-behavioral correlates.
Strengths:
Pairing dual recordings of medial prefrontal cortex (mPFC) and CA1 with learning of spatial memory tasks is a strength of this paper. The authors also discovered an interesting population of prefrontal neurons modulated by both beta and CA1 sharpwave ripple (SWR) events, showing a relationship between SWR-excited and SWR-inhibited neurons and beta oscillation phase.
Weaknesses:
Moreover, there is little detail provided about sample sizes and how data sampling is being performed (e.g., rats, sessions, or trials), raising generalizability concerns.
We appreciate Reviewer 3’s thoughtful suggestions for making our claims convincing. We have included information about sample sizes in the revised manuscript.
The authors report on a task where rats were performing sub-optimally (F-maze), weakening claims.
Our experiment was designed to create a scenario in which one task was learned (Y-maze) and another was not (F-maze). This contrast allows us to determine differences in neural correlates of learning versus familiarity. The design produced a learned and not learned task with similar levels of familiarity over 5 days, within the same animal.
Likewise, it is questionable as to whether mPFC and hippocampus are dually required to perform a no-delay Y-maze task at day 5, where rats are performing near 100%.
We agree with Reviewer 3 that the mPFC and hippocampus may not be required when the animal reaches stable performance on day 5 (Deceuninck & Kloosterman, 2024). The data we collected spans the full range of early learning (day 1) to proficiency (day 5). We wanted to understand the dynamics of beta across these learning stages, which have not been reported previously.
Recent studies suggest mPFC and hippocampus are likely to be needed, in some capacity, for learning continuous spatial alternation tasks on a range of maze geometries. Lesions, inactivation or waking activity perturbation of hippocampus or hippocampus and mPFC on the W maze alternation task slowed learning (Jadhav et al., 2012; Kim & Frank, 2009; Maharjan et al., 2018). More recently, optogenetic silencing of mPFC after sharp wave ripples on the Y-maze alternation affected performance when the center arm was switched (den Bakker et al., 2023). The Y and F-mazes in our study both share the continuous alternation rule, where the animal needed to avoid visiting a previously visited location on the outbound choice relative to the center, and always return to the center location.
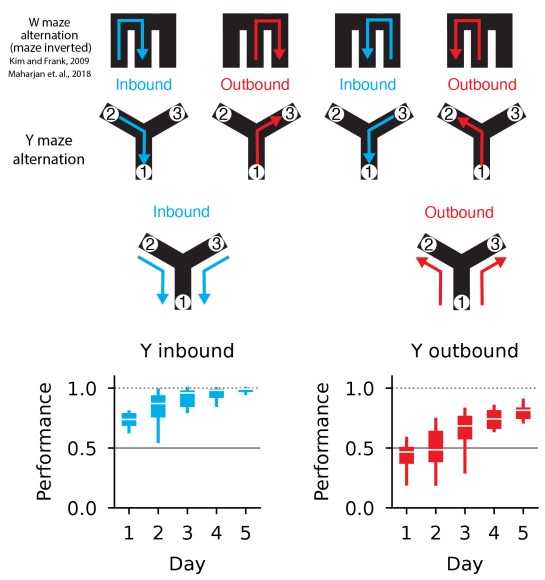
Further, the performance characteristics on the outbound and inbound components of our Y task are similar to the W task. We have analyzed the “inbound” and “outbound” performance of the animals on the Y-maze alternation task, and they are similar to the W maze alternation task. The “inbound” or reference location component is learned quickly whereas the “outbound”, alternation component is learned slowly.
There would be little reason to suspect strong oscillatory coupling when task performance is poor and/or independent of mPFC-HPC communication (Jones and Wilson, 2005) potentially weakening conclusions about independent beta rhythms.
Although many studies have examined the oscillatory coupling properties at the theta frequency between mPFC-HPC (Hyman et al., 2005; Jones & Wilson, 2005; Siapas et al., 2005), our understanding of beta frequency coordination between the two regions is less established, especially at goal locations. Our work suggests beta frequency coordination at goal locations does not share properties with those of theta frequency coupling between mPFC and HPC, which occurs primarily during movement on the maze. Our first novel finding is that beta oscillations occur at goal locations in mPFC and HPC; our second is that the beta frequency dynamics in these regions are surprisingly distinct. We are not aware of prior work describing these properties at goal locations in spatial navigation tasks, especially their temporal coordination.
Reviewer #3 (Recommendations for the authors):
(1) The conclusions from this article would be made much stronger if the authors (1) record from rats performing a task known to be dependent on mPFC-HPC communication (e.g. a spatial working memory task) or (2) record from the F-maze in well-trained rats (75-80% performance is common), or (3) show that Y-maze task performance is dependent on mPFC-hippocampal communication (see Maharjan et al., 2018, which used a W-track). It is possible that learning the Y-maze depends on mPFC-hippocampal communication, but that with asymptotic performance, this changes. This would put beta oscillation coupling findings into a nuanced perspective.
We appreciate the recommendation. The objective of this current manuscript is to present previously unknown properties of beta oscillations in hippocampal-prefrontal cortical networks. We agree that further investigation is required to fully dissect the functional contribution of beta dynamics in these networks. We are in the process of doing that.
The rule on the Y-maze in our experiment is identical to the continuous alternation rule on the W maze in Maharjan et al., 2018 and Kim and Frank, 2009 (Author response image 1), which showed the PFC and hippocampus are required for normal learning, respectively. The Y and W mazes share the same topology; there is one junction connecting three arms. The W maze has two 90-degree-angle turns which are not choice points. Thus, both maze tasks have one choice point and involve learning an alternation rule. Further the learning properties share similarities. For the Y-maze, the inbound portion (return to center) (Author response image 1) was quicker to learn than the outbound portion (alternation) (Author response image 1). The same pattern is observed in the W maze learning task (Maharjan et al., 2018, Fig. 3A and D, Kim and Frank, Fig. 4C). We agree an experiment is needed to show that Y-maze task learning is dependent on the function of hippocampal-prefrontal cortical networks. The shared topology, rule definition, and behavior profile suggest that the Y and W maze tasks engage similar learning processes.
Author response image 1.
W and Y maze alternation tasks share the same rule. Schematics illustrate a comparison of W and Y maze alternation task rules. The W maze has been inverted for visual comparison with the Y maze. Performance grouped by in- or outbound trials. Inbound trials originate from the side goals (2 or 3). Outbound trials originate from the center goal (1). Performance on the inbound trials was higher than that on the outbound trials, which is comparable to previously published alternation tasks on W-shaped mazes.
(2) Typically, when analyzing LFP profiles, experimenters include running velocity/speed. It should be ruled out whether spectral changes are confounded in any way by speed or time spent in the goal zones.
We appreciate this suggestion for better conveying our definition of goal period. This was raised by other reviewers. We have now included the speed profiles for the goal-entry-aligned spectrograms (Fig. 1B, 1-4, 2A, and 6A), as well as the speed quantification at the times of bursts (Fig. 3-1, Fig. 4-1) and SWRs (Fig. 6-1 D). We strictly define the goal period after entry into the sensor on the reward delivery device at the end of the arms. This is to ensure the animal is immobile for the period to avoid confounds related to speed. We also ensured the time periods are comparable between the trials we analyzed.
(3) The authors should describe in each analysis how data are sampled, and for extracellular electrophysiology experiments, cell counts from each rat reported. A table would be ideal. For example, it is unknown if entrainment analysis is performed on data collected from one rat or from all rats.
We have now added the missing information (Table 1-2, 5-1 to 5-3). We performed analyses using data from all animals.
(4) There was no profiling of mPFC neurons in terms of their behavioral correlates. The authors should strongly consider examining how individual neurons encode task variables (e.g., trial correctness, reward location...) and can do so using a generalized linear model. Adding an analysis of behavioral correlates could nicely tie into the beta-SWR analyses. For example, are SWR-beta rhythm-modulated neurons also behaviorally modulated?
This is a very helpful suggestion. We have added analyses on the behavioral correlates of PFC and CA1 neurons. We quantified three metrics: 1) whether PFC and CA1 spiking activity can distinguish goal location based on firing rate or phase preference, 2) firing distance to goal and 3) spatial information (Fig. 5 and 7). We also performed the same analysis based on SWR and beta modulation status. We found PFC cells that were both SWR- and beta-modulated showed the strongest task firing relationship (Fig. 7).
(5) Figure 2:
Are these data analyzed from well-trained rats? What is your N (rats/sessions/trials/epochs)?
These results in Fig. 2 are from all days. We added the breakdown in Table 2-1.
(6) Figure 3:
(a) The authors show that on the Y-maze, performance, beta oscillations power, and beta oscillation frequency change over days. However, for the F-maze, performance improves but appears to taper off at 60% and PFC beta frequencies do not change with learning. Do you have rats performing this task well above chance (e.g., 75-80%?), and if so, do beta oscillation frequencies in the mPFC gradually change?
We did not observe rats performing above chance on the F-maze over 5 days. They do not appear to learn the alternation rule on this task. This is why we used the F-maze as the “non-learner” control. The F-maze task design for this study appears to be difficult to learn and would likely require a much longer training period for the performance to exceed chance. We agree an important follow-up question is whether the effects reported here are generally observed across learning in different tasks. This is a future direction we are actively pursuing.
One existing data point may partially address the relevance of beta power change with learning. We analyzed the power as a function of performance quintile on the Y-maze (learned) or F-maze (not learned). The power changed with performance quintile on the Y-maze (learned) but not the F-maze (not learned) (Fig. 3D), pointing to the change in power being associated with learning status.
(b) Does the proportion of beta bursts change with learning? What about the proportion of coherent events?
We performed this analysis and the results are shown in Fig. 3-3. We found a decrease in the proportion of coincident bursts within CA1, which was specific to the well-performed Y-maze.
(c) Is the reduction in beta oscillation frequency in the mPFC related to running behavior? This should be ruled out. Same for the hippocampus.
The reduction is not due to running because we only included bursts when the animal was at the goal and immobile. We added a figure to show speed at the time of bursts (Fig. 3-1).
(d) Why don't you also show coherence as a function of learning?
This is a great suggestion. Coherence as a function of day or performance is now shown in Fig. 3-2. Overall, the trends were weak suggesting there was no strong change in coherence over days or as a function of learning. Although some of the linear mixed effects models were statistically significant, the marginal R2 values (R2m) were very low, indicating the effects of performance or day on coherence were small. Beta frequency coherence within each brain region either remained the same or slightly decreased across days (Fig. 3-2 D and F) or with performance (Fig. 3-2 J). For coherence across regions, we only found a weak but significant increase for the well-performed Y-maze task across days (Fig. 3-2 B).
(e) The statistics in the caption are great, but maybe consider using a table and a supplemental figure
We have now included the most relevant model output in the figure. These are the marginal R2 (R2m) and conditional R2 (R2c). These describe the contribution of the fixed or fixed and random effects on the model, respectively.
(7) Figure 4
(a) This figure is better suited as supplemental to Figure 3.
We have combined Fig. 4 with Fig. 3.
(b) Statistics might be better suited in a table and a supplemental figure.
We have now included the most relevant model output in the figure. These are the marginal R2 (R2m) and conditional R2 (R2c). These describe the contribution of the fixed or fixed and random effects on the model, respectively.
(8) Figure 5
(a) The shift of beta rhythms being linked to learning is interesting, albeit confusing, given that error trials were accompanied by even more 'precise' beta rhythm timing. Is it possible that beta rhythms are accompanied by an error signal? Or maybe instead related to running behavior?
We verified this observation was not due to speed since we only included periods when the animal was at the goal and immobile. We added a new supplemental figure (Fig. 4-1) to report this analysis.
(b) Changes in beta rhythm timing in the F-maze could be entirely explained by the data in the Y-maze, given that F-maze performance was, in general, very low. To test if beta rhythm shifting is a consequence of learning, the authors should show performance on the F-maze without the Y-maze, and vice versa.
As suggested, we also analyzed frequency variance data from each maze separately and found learning-related changes were more prominent on the Y-maze (learned) than on the F-maze (not learned) (Fig. 4-4 C). The F-maze data serves as a valuable control within the same animal for the learning-related effects we are reporting.
We agree that the Y-maze data is consistent with performance-related changes to beta timing. The addition of the F-maze provides a within-animal comparison for a task in which the animal performed less well. We agree an additional control group would provide further evidence to support learning-related changes in beta timing. However, the F-maze will likely take much longer to learn, therefore the additional days of exposure on the task will be a different confound. Thus, we wanted to ensure that we compared a “learned” with a “not learned” task within the same animal, with a comparable exposure period.
(9) Figure 6
(a) How many cells are analyzed here? Are they all pyramidal neurons? The authors should add the number of cells analyzed from each rat. A table would suffice.
We added tables (Table 5-2 to 5-4) to show this information. For our analysis, we included all units.
(b) The authors should include statistics about recorded units. Peak-to-trough timing and interspike interval are commonly used. Even demonstration of action potentials from individual cells is valuable for proof of concept.
We have added more information on the cell type classification (Table 5-2) and how we classified the cells (Methods) and also added example waveforms in Fig. 5 (previously Fig. 6).
(c) Why did the authors stop comparing the F-maze and Y-maze for entrainment analysis?
The data for each maze was comparable. Per the reviewer’s suggestion, we added the entrainment analysis for each maze separately (Fig. 5-1).
(10) Figure 7
(a) The authors should minimally include instantaneous velocity to show that during putative ripple events, the animal is in fact, quiescent.
We added the speed at the time of ripples in Fig. 6-1 D.
(b) Figure 7C: The authors should show how time spent in the reward zones varies over days. Is SWR power simply changing due to behavioral occupancy differences (e.g., a statistical sampling problem)? An analysis of the SWR rate over days would be valuable.
We agree and have added additional SWR properties across days in Fig. 6-1. This includes SWR power (Fig. 6-1 A), rate (Fig. 6-1 B), duration (Fig. 6-1 C) and speed (Fig. 6-1 D). To ensure we are comparing the equivalent time spent at goals, the SWR properties were calculated from the 10 s after goal entry (Fig. 6-1) and we only included goal visits that lasted at least 10 s. This controls for the potential confounds from occupancy differences across days.
(c) Why did the authors stop comparing the F-maze and Y-maze for SWR analysis?
The SWR properties were similar in both tasks. We have now added separate analyses for each maze in Fig. 6-1 and 6-2.
(11) Figure 8
(a) The authors discovered that mPFC neurons more strongly entrained to SWRs compared to their own beta rhythms, potentially indicating coordination of mPFC and hippocampus (lines 275:276). What about mPFC spiking to CA1 beta?
We quantified mPFC spiking entrainment to CA1 beta in Fig. 5 O and P. We found mPFC cells were more strongly entrained to the local beta within mPFC compared with CA1 beta.
(b) Lines 277:278: How did the authors arise at 8.6% being the expected proportion of neurons entrained by both SWRs and beta rhythms?
We have added a better explanation of how we arrived at the expected proportion. The calculation is based on the joint probability between the proportion of neurons modulated by SWRs (30%) and the proportion of neurons with phase locking to beta rhythms (22%). The expected proportion (6.6%) is calculated by multiplying the two values (30% ´ 22%) under the assumption that the two classes are independent. Deviations from the expected proportions are determined using a Fisher’s exact test.
We note that in the revised manuscript we reanalyzed the data with more stringent criteria. We now include SWRs with durations greater than 50 ms, rather than 15 ms, and we quantify beta spike phase-locking using only the spikes within the first 5 s after goal entry, for goal visits lasting at least 5 s.
With these more conservative criteria, the proportion of SWR- and beta-modulated cells (8%) is no longer significantly different from the expected proportion (6.6%, Fisher’s exact test p=0.09). Although this differs from our original significance test, the trend, and importantly, the distinct task correlates for this population (Fig. 7 C-D) still hold. We have updated the revised manuscript with these findings.
Our original result was: “The subset of PFC cells that are modulated by both SWR and beta (11%) is greater than the expected proportion (8.6%) under the assumption that SWR and beta can modulate the population independently (Fisher exact test, p=0.021), although the size of the difference is small.”
(c) The discovery that neurons modulated by both beta and SWRs are unique from those simply modulated by beta is really interesting. The authors discovered an interesting relationship among dually entrained mPFC neurons whereby SWR-excited mPFC neurons were entrained to the peak of beta, whereas SWR-inhibited mPFC neurons were entrained to the trough of beta. Then, in lines285:286, the authors write:
(12) "This relationship was not observed for PFC cells that are modulated by beta but not modulated by SWRs (Fig. 8C, right, Fig. 8-1A)."
Why would the authors expect this relationship to exist when the mPFC neurons were not SWR modulated? Were the authors referring to something else?
We should have phrased this more clearly. We edited the text to better convey the expected SWR and beta modulation patterns for the control populations. We wanted to ensure the relationship between SWR modulation direction and beta phase preference was not observed for the cells that were not SWR-modulated.
Furthermore, what about mPFC neurons that are SWR modulated but not beta modulated? For completeness, the authors should examine these.
We agree this is an important comparison and have now included this population in the new Fig. 7. As expected, we do not find any relationship between SWR modulation direction and spike preference to beta for the SWR-modulated and not beta-modulated population.
(13) Lines 294:296: The authors should elaborate on how they obtained an expected proportion of CA1 beta modulated neurons.
We have now added a description for calculating the expected number of beta-modulated CA1 neurons. These are the neurons that have a Rayleigh test p-value less than 0.05.
(14) What are these neurons doing to predict task information? Do they at all? Do they differ from beta-only neurons or non-phase-locked neurons?
This is a great suggestion, and we have added analyses to show the task correlates for the cells. We found brain region-specific differences for task correlates that depended on how the cell was modulated by SWRs or local beta oscillations. This is shown in the updated Fig. 7 and the accompanying supplemental Figs. 7-1 to 7-2.
For PFC cells, SWR and beta modulation status defined a subpopulation with a strong task structure correlation. There was a positive correlation between the direction of SWR modulation and the spiking distance relative to goals. SWR-excited cells were more active further away from goals, whereas the SWR-inhibited cells were active closer to goals. This correlation was not found for SWR-modulated PFC cells that were not beta-modulated. For PFC cells, the direction of SWR modulation is known to be correlated with movement speed, consistent with the hypothesis that movement-active cells become reactivated during SWRs, and immobility-active cells become suppressed (Jadhav et al., 2016; Yu et al., 2017). We found the same relationship, the direction of SWR modulation was positively correlated with mean spiking speed. Our results show beta modulation marks a subpopulation of PFC cells with stronger task-structure correlates.
For CA1 cells, we found the expected relationship between SWR modulation and task-structure correlates. SWR-excited CA1 cells spiked further away from the goal and when the animal was moving. This is consistent with the reactivation of trajectory-related spatial firing patterns during movement on the maze. This pattern was observed irrespective of beta modulation status.
Ahmed, O. J., & Mehta, M. R. (2012). Running speed alters the frequency of hippocampal gamma oscillations. J Neurosci, 32(21), 7373-7383. https://doi.org/10.1523/JNEUROSCI.5110-11.2012
Berke, J. D., Hetrick, V., Breck, J., & Greene, R. W. (2008). Transient 23-30 Hz oscillations in mouse hippocampus during exploration of novel environments. Hippocampus, 18(5), 519-529. https://doi.org/10.1002/hipo.20435
Deceuninck, L., & Kloosterman, F. (2024). Disruption of awake sharp-wave ripples does not affect memorization of locations in repeated-acquisition spatial memory tasks. Elife, 13. https://doi.org/10.7554/eLife.84004
den Bakker, H., Van Dijck, M., Sun, J. J., & Kloosterman, F. (2023). Sharp-wave-ripple associated activity in the medial prefrontal cortex supports spatial rule switching. Cell Rep, 42(8), 112959. https://doi.org/10.1016/j.celrep.2023.112959
França, A. S., do Nascimento, G. C., Lopes-dos-Santos, V., Muratori, L., Ribeiro, S., Lobão-Soares, B., & Tort, A. B. (2014). Beta2 oscillations (23-30 Hz) in the mouse hippocampus during novel object recognition. Eur J Neurosci, 40(11), 3693-3703. https://doi.org/10.1111/ejn.12739
França, A. S. C., Borgesius, N. Z., Souza, B. C., & Cohen, M. X. (2021). Beta2 Oscillations in Hippocampal-Cortical Circuits During Novelty Detection. Front Syst Neurosci, 15, 617388. https://doi.org/10.3389/fnsys.2021.617388
Hyman, J. M., Zilli, E. A., Paley, A. M., & Hasselmo, M. E. (2005). Medial prefrontal cortex cells show dynamic modulation with the hippocampal theta rhythm dependent on behavior. Hippocampus, 15(6), 739-749. https://doi.org/10.1002/hipo.20106
Iwasaki, S., Sasaki, T., & Ikegaya, Y. (2021). Hippocampal beta oscillations predict mouse object-location associative memory performance. Hippocampus, 31(5), 503-511. https://doi.org/10.1002/hipo.23311
Jadhav, S. P., Kemere, C., German, P. W., & Frank, L. M. (2012). Awake hippocampal sharp-wave ripples support spatial memory. Science (New York, N.Y.), 336(6087), 1454-1458. https://doi.org/10.1126/science.1217230
Jadhav, S. P., Rothschild, G., Roumis, D. K., & Frank, L. M. (2016). Coordinated Excitation and Inhibition of Prefrontal Ensembles during Awake Hippocampal Sharp-Wave Ripple Events. Neuron, 90(1), 113-127. https://doi.org/10.1016/j.neuron.2016.02.010
Jin, S. W., Ha, H. S., & Lee, I. (2024). Selective reactivation of value- and place-dependent information during sharp-wave ripples in the intermediate and dorsal hippocampus. Sci Adv, 10(32), eadn0416. https://doi.org/10.1126/sciadv.adn0416
Jones, M. W., & Wilson, M. A. (2005). Theta Rhythms Coordinate Hippocampal–Prefrontal Interactions in a Spatial Memory Task. PLoS Biology, 3(12). https://doi.org/10.1371/journal.pbio.0030402
Kim, S. M., & Frank, L. M. (2009). Hippocampal Lesions Impair Rapid Learning of a Continuous Spatial Alternation Task. PLoS ONE, 4(5). https://doi.org/10.1371/journal.pone.0005494
Lansink, C. S., Meijer, G. T., Lankelma, J. V., Vinck, M. A., Jackson, J. C., & Pennartz, C. M. (2016). Reward Expectancy Strengthens CA1 Theta and Beta Band Synchronization and Hippocampal-Ventral Striatal Coupling. J Neurosci, 36(41), 10598-10610. https://doi.org/10.1523/JNEUROSCI.0682-16.2016
Maharjan, D. M., Dai, Y. Y., Glantz, E. H., & Jadhav, S. P. (2018). Disruption of dorsal hippocampal-prefrontal interactions using chemogenetic inactivation impairs spatial learning. Neurobiol Learn Mem, 155, 351-360. https://doi.org/10.1016/j.nlm.2018.08.023
Rangel, L. M., Chiba, A. A., & Quinn, L. K. (2015). Theta and beta oscillatory dynamics in the dentate gyrus reveal a shift in network processing state during cue encounters. Front Syst Neurosci, 9, 96. https://doi.org/10.3389/fnsys.2015.00096
Siapas, A. G., Lubenov, E. V., & Wilson, M. A. (2005). Prefrontal Phase Locking to Hippocampal Theta Oscillations. Neuron, 46(1), 141-151. https://doi.org/10.1016/j.neuron.2005.02.028
Yu, J. Y., Kay, K., Liu, D. F., Grossrubatscher, I., Loback, A., Sosa, M.,…Frank, L. M. (2017). Distinct hippocampal-cortical memory representations for experiences associated with movement versus immobility. Elife, 6, e27621. https://doi.org/10.7554/eLife.27621



