
Peer review process
Revised: This Reviewed Preprint has been revised by the authors in response to the previous round of peer review; the eLife assessment and the public reviews have been updated where necessary by the editors and peer reviewers.
Read more about eLife’s peer review process.Editors
- Reviewing EditorJenny TungMax Planck Institute for Evolutionary Anthropology, Leipzig, Germany
- Senior EditorDetlef WeigelMax Planck Institute for Biology Tübingen, Tübingen, Germany
Reviewer #1 (Public review):
Ma et al. use human-chimpanzee tetraploid cells, across different cell types, to identify the genetic causes and then transcriptomic consequences of divergence in DNA methylation. They conclude that the evolution of DNA methylation is driven primarily by cis-regulatory changes, and that the evolution of CpG sites contributes to cis-regulation while transcription factor expression underlies some trans changes. They then argue that divergence in DNA methylation is associated with changes in gene expression and may contribute to human phenotypes.
The tetraploid model is able to provide compelling evidence that most regulatory evolution occurs due to cis-regulatory changes, and that sites that have diverged in DNA methylation level cluster together into DMRs which share similar divergence patterns and genetic architecture. This stands in intriguing contrast to trans-mechanisms which explain most variation within modern human populations. The authors proceed to show that trans-effects can be explained, in part, by nearby TF binding motifs and many cis-regulatory changes are explained by CpG-disrupting variants. While these mechanisms clearly contribution to divergence in DNA methylation, the degree to which they explain cis- and trans-regulatory divergence would be valuable.
Next, the authors seek to show that differences in DNA methylation are functionally relevant. Consistent with previous results, they show that differences in DNA methylation are (weakly) associated with changes in gene expression. They hypothesize that genes with concordant regulatory should exhibit great methylation-expression coupling than other genes and show that cis-expression/cis-methylation pairs are more strongly correlated than trans/trans pairs. I think that looking at cis/trans or trans/cis changes would also be useful. Another limitation is that this analysis is limited to promoter regions. It is not clear how many divergent DMRs that includes and how many of those genes have differences in expression. The key question is whether differences in DNA methylation are functionally important, and the answer provided by these analyses is "sometimes".
Finally, the authors make a case for lineage-specific selection on DNA methylation that is connected to human traits. Using a sign-test, they identify sets of genes which have likely experienced selection in humans and may underlie human phenotypes.
In conclusion, I think this study provides a valuable resource for differences in DNA methylation between humans and chimpanzees across tissues and provides important insight into the relative abundance of cis and trans regulatory divergence. Additional research is necessary to investigate the underlying regulatory mechanisms and more care needs to be taken in exploring the functional consequences.
Reviewer #3 (Public review):
Summary:
Ma et al. use human-chimpanzee tetraploid cells to examine species differences in DNA methylation. They identify differentially methylated regions under cis or trans regulation. Cis-DMRs are enriched near SNVs that disrupt or create CpGs, providing a plausible mechanism for cis changes in methylation. They also seek to identify transcription factors that might affect methylation in trans, as well as gene sets with evidence for consistent changes in methylation and expression between humans and chimpanzees, suggesting that they may underlie lineage-specific traits.
Strengths:
The authors have generated a new dataset across multiple different cell types examining differences in DNA methylation between humans and chimpanzees using human diploid cells, chimpanzee diploid cells, and human-chimpanzee tetraploid cells. Using this dataset, they identify that cis-DMRs are enriched near SNVs that disrupt or create CpGs compared to trans-DMRs and identify transcription factors as candidate trans-acting factors. Both identified SNVs and transcription factors are good candidates for future experimentation. The authors also find that cis-DMRs are more highly correlated with cis-expressed genes than trans-DMRs with trans-expressed genes, providing evidence that methylation and expression are linked genome-wide. Further, they apply a clever sign test approach to identify gene pathways with evidence for lineage-specific selection.
Comments on revised version.
They authors have addressed my concerns from their initial manuscript. In particular, the authors have noted the limitations of their study as appropriate, including the use of permissive FDR cut-offs.
Author response:
Summary of changes:
(1) Framing of the sign test results. Throughout the manuscript we have clarified that the sign test provides direct evidence that the implicated gene sets are under lineage-specific selection, while the connection of this selective signal to any specific human phenotype is inferential and would require experimental validation. We also now emphasize that some sign test results are expected to be false positives, as indicated by the FDR.
(2) FDR and cis:trans quantification. We have added explicit statements that (i) the cis dominance is consistent across a range of FDR thresholds (FDR < 0.25, 0.20, 0.10, 0.05, 0.01), (ii) the mean proportion of divergent sites explained by cis-regulation is 91%, and (iii) using the changepoint detection method, we identified 9159 cis-DMRs and 2046 trans-DMRs in total for downstream TF motif and SNV analysis. A power analysis comparing sensitivity to detect cis vs. trans effects is provided as author response image 1.
(3) Clarification of regulation groups, including pure cis, pure trans, conserved, cis × trans and cis + trans. We have added explicit definitions of these categories in the Results.
(4) Cis-gene direction-of-effect definition. We have clarified in the text that cis-regulated genes are defined as those where the direction of allelic difference is consistent between hybrid and parental samples. We note that the scatter plots in Figure 2B as well as Figure 2 supplemental figures plots the per-sample average percent difference in methylation. Cis genes appearing to have opposite direction-of-effect along the y=x diagonal on the scatter plot were due to a difference between this average, used only for visualization, and the values used for analysis in our statistical model. For values close to zero, average log2FC or per cent difference can flip sign even when the model correctly identifies the site as cis-regulated. The regulation classification is based on a statistical model and not the direction of average difference, so there will naturally be some small deviation around the axes when visualizing the results as a scatter plot.
(5) New limitations. We have added four new limitations to the Discussion: (i) absence of an outgroup species; (ii) TFBS-disrupting mutations as an alternative cis mechanism; (iii) the need for experimental validation of SNV-methylation and TF-methylation links; and (iv) the scope of cell types examined.
(6) Quantitative reporting. We have replaced "substantial" with specific numbers throughout.
(7) Additional supplemental resource. A list of cis–cis regulated promoters and their associated genes has been added as Supplemental File 8.
(8) Minor corrections. Missing citation for Hallgrímsdóttir et al. (2024) added; "Preprint at" removed from published paper citations; sequencing coverage reported in Methods.
eLife Assessment:
This study presents an important examination of the role of cis-acting versus trans-acting genetic variation on DNA methylation divergence between humans and chimpanzees, including its consequences for gene expression. By differentiating fused interspecies tetraploid cell lines into multiple cell types, the study provides compelling evidence for the importance of cis-acting changes, but incomplete evidence that these changes are of importance for adaptive trait evolution in humans. This work will be of interest to biologists and evolutionary anthropologists studying the evolution and genetics of gene regulation, particularly in primates.
We appreciate the assessment and agree that the evidence for adaptive trait evolution is indirect. We would like to clarify what the sign test does and doesn’t establish. By rejecting a rigorous neutral null model, the sign test provides strong evidence for lineage-specific selection on DNA methylation divergence. Since the coordinated directional divergence we observe is not expected under neutral evolution, we are confident that the data are evidence of selection. However, the sign test does not identify the specific traits that selection acted upon; the connection between the signal of selection and any phenotype is speculative. Accordingly, we have now revised the manuscript to describe the sign test results as evidence of selection while keeping the interpretation of specific traits explicitly speculative. We also added discussion of the limitations on the trait-level inference (such as the absence of an outgroup, reliance on clinical HPO ontologies, etc.).
Reviewer #1 (Public review):
Ma et al. use human-chimpanzee tetraploid cells across different cell types to identify the genetic causes and then transcriptomic consequences of divergence in DNA methylation. They conclude that the evolution of DNA methylation is driven primarily by cis-regulatory changes, and that the evolution of CpG sites contributes to cis-regulation, while transcription factor expression underlies some trans changes. They then argue that divergence in DNA methylation is associated with changes in gene expression and may contribute to human phenotypes.
We thank Reviewer 1 for a detailed summary of our work.
The tetraploid model is able to provide compelling evidence that most regulatory evolution occurs due to cis-regulatory changes. My only concern is that the extent of trans-changes may be overstated, as almost all are eliminated by changing from a nominal p-value criterion to even a 25% false discovery rate.
We agree that trans-effects are more sensitive to FDR thresholds than cis-effects, and we have addressed this directly. This is a well-recognised limitation of existing cis/trans classification frameworks, and we acknowledge this limitation in the discussion and have added suggestions in experimental set-up to mitigate it. To address the reviewer's concern directly, we have added a formal power analysis quantifying the relative power to detect cis and trans effects as a function of read depth as well as biological noise (dispersion). We now explicitly state in the Results that the cis dominance over trans is consistent across a range of FDR cutoffs (FDR < 0.25, 0.20, 0.10, 0.05, 0.01; Figure 2—figure supplement 1–2), and we note that the greater FDR-sensitivity of trans-DMRs likely reflects systematically smaller effect sizes rather than false positives. We have added a power analysis in Author response image 1 that formally compares our sensitivity to detect cis vs. trans effects. We also note that DMR-level analyses recover both cis and trans effects at meaningful FDRs, consistent with the idea that trans effects are real but requires more replicates as well as a higher sequencing depth to make significant calls at the same level as cis changes at the individual CpG level.
Author response image 1.
Power analysis of cis and trans effects detected by the beta-binomial GLM framework. For each combination of effect size, per-unit read depth, and overdispersion (φ), we simulated a genome of 10,000 units — either individual CpG sites or regions/DMRs — comprising 2,000 true-effect units and 8,000 null units. The simulation is unit-agnostic: a "unit" represents a single CpG when modeling the per-CpG analysis and an aggregated region when modeling the regional (DMR-level) analysis, with read depth interpreted as the per-CpG coverage or the region-level (aggregate) coverage, respectively, and effect size as the corresponding per-CpG or region-level H–C methylation difference.
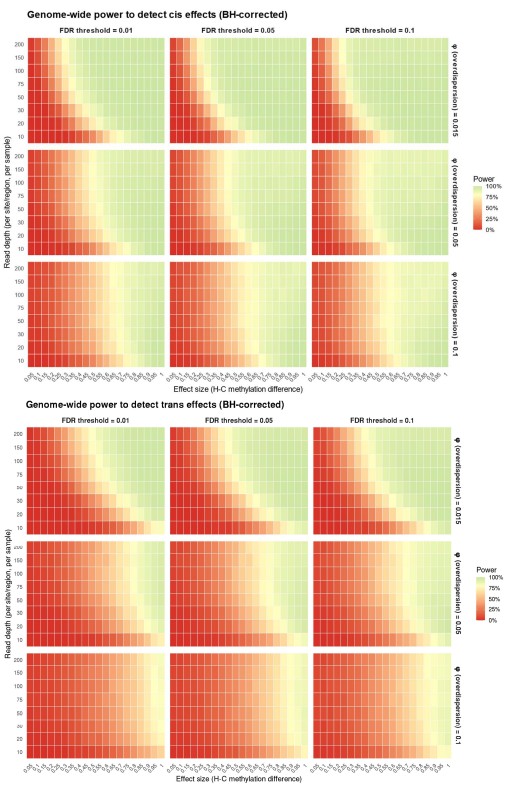
Effects were classified using the same two-model scheme as the main analysis. A unit was called cis if the hybrid allelic (H–C) test was significant and the allele-by-generation interaction was not significant, and trans if the interaction was significant and the hybrid allelic test was not significant; all tests were Benjamini–Hochberg–corrected across the genome at the stated FDR threshold. Each unit was simulated with the full six-measurement design (two parental samples and four hybrid alleles from two hybrids), both models were fit, each set of p-values was BH-corrected across the genome, and "power" is the fraction of true units that land in the correct class.
Cis-effect units were simulated with an equal H–C difference in both parents and hybrid (zero true interaction); trans-effect units with a parental H–C difference and no hybrid allelic difference (full-magnitude interaction); null units with no difference in either parents or hybrid. Sequencing depth was treated as a fixed design parameter: every sample at every simulated unit was assigned the same total read depth (the value on the y-axis of the heatmaps), corresponding to per-CpG coverage for the site-level analysis or aggregate per-region coverage for the regional analysis.
We estimated the beta-binomial overdispersion (φ) directly from the data for each cell type used in this study: DA = 0.024, CNCC = 0.016, IPSC = 0.013, SKM = 0.014, and HEP = 0.011 (median = 0.014). To span this empirical range and to assess robustness to higher-than-observed dispersion, we evaluated power at φ = 0.015 (approximating the empirically observed median), 0.05, and 0.10; the latter two represent substantially more conservative (higher-noise) scenarios than any cell type in our data. Because power declines monotonically with φ, the φ = 0.015 row reflects the sensitivity expected under realistic conditions, while the higher rows bound the worst case. For each unit, a methylation probability was drawn from a beta distribution whose mean equals the unit's true methylation level and whose dispersion is set by the overdispersion parameter φ, and the number of methylated reads was then drawn from a binomial with that probability and the specified total depth. Consequently, the reported power describes the sensitivity expected at a given uniform per-unit (per-CpG or per-region) depth, spanning 10× to 200×, and is interpreted as the proportion of true-effect units assigned to the correct class.
The follow-up analyses are incomplete with major gaps. The authors focus on single potential mechanisms for cis- and trans-changes, but it is not clear to what degree these mechanisms explain the extent of cis and trans changes. There are also other mechanisms which are not investigated, such as the importance of TF binding sites for cis-regulatory evolution.
We agree that CpG-disrupting SNVs and TF binding motifs are just two out of many possible mechanisms, and we have added explicit acknowledgements of this in the text. Our goal was not to investigate all possible mechanisms, but rather to focus on two that showed promising results. For cis-regulation, we now state that TFBS mutations and other sequence variants could also contribute. We agree that further mechanistic investigation is an important direction for future work, and we have noted this explicitly in the Discussion.
Next, the authors seek to show that differences in DNA methylation are functionally relevant... I worry that this result could be confounded by larger effect sizes for cis-changes than trans effects.
We agree that larger cis-regulatory effect sizes could contribute to this result, and have now mentioned this in the Discussion: “This finding suggests that the repressive effects of species-specific methylation are strongest when both layers of regulation are driven in cis, perhaps because cis-regulated methylation changes tend to have larger effect sizes than trans-regulated changes.”
Finally, the authors make a case for lineage-specific selection on DNA methylation that is connected to human traits. This evidence was not convincing. In fact, it is even said that these tests cannot be interpreted as evidence of lineage-specific selection (lines 399-401), so I am confused why these results are framed as testing for selection.
We appreciate this comment but want to clarify. Lines 399–401 in the original manuscript state that the dental pulp stem cell (DPSC) sign test results specifically should not be interpreted as evidence of lineage-specific selection, because DPSCs use parental rather than hybrid cell lines. This caveat applies only to DPSCs. For all other cell types (iPSC, DA, CNCC, SKM, HEP), which use hybrid cell lines that control for trans-acting confounders, the sign test does indeed provide evidence of non-random directional bias inconsistent with neutral evolution, thereby constituting evidence of lineage-specific selection. We have added a clarifying sentence to make this distinction explicit: "For all other cell types (iPSC, DA, SKM, HEP, CNCC), which use hybrid cell lines, the sign test results provide direct evidence of lineage-specific selection on the implicated gene sets, as the hybrid system controls for trans-acting confounders."
To be clear about the scope of the claim: the sign test directly demonstrates that the implicated gene sets are under lineage-specific selection. What remains inferential is the connection between this selective signal and any specific human phenotype, which would require experiments or further validation to establish; we have revised the framing throughout to keep this distinction explicit.
Reviewer #1 (Recommendations for the authors):
(1) Line 96: How many iPSC lines were used for each species? When a replicate is mentioned (e.g., Figure 1B), are those technical or biological replicates?
We have added the iPSC line counts to both the Results and Methods sections: two human and two chimpanzee iPSC lines were used. Replicates shown in Figure 1B are biological replicates (independent differentiation experiments from the same iPSC lines).
(2) Line 98: How many donors for the DPSCs?
We have added DPSC donor counts to the Methods: two human and two chimpanzee donors.
(3) Line 103: PCA and other analyses combined data from WGBS and RRBS cell types. Some clarification about how this was done (e.g. restricting to RRBS sites?) would be useful in the main text as well as an acknowledgement of potential biases. And
(4) Line 103: Related, what is the number of CpG sites considered?
We have added a clarifying sentence to the Results: cross-cell-type analyses including Figure 1B heatmap and Figure 1C PCA analysis were restricted to CpG sites covered in all samples (i.e., the intersection of all covered sites, after phasing the hybrid samples), totaling 561,762 shared CpG sites. Within-cell-type PCA analysis in Figure 1—supplemental figure 1 was restricted to CpG sites shared across samples of the same cell type, which contains 31,802,196 sites for CNCC samples, 26,163,237 sites for DA, 29,787,850 sites for DPSC, and 1,006,674, 935,636 and 952,835 sites for IPSC, SKM and HEP, respectively. We acknowledge that this restriction to the intersected CpG sites result in PCA performed on sites covered by both WGBS and RRBS, which are most frequent in CpG-dense regions.
(5) Line 103: For Figure 1B, it would be useful to first mention how human/chimp reads were parsed and for how many CpG sites this was possible.
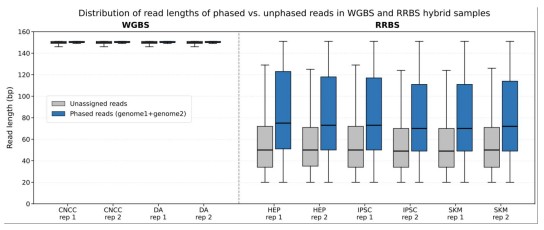
We have added a brief description of the allele-parsing approach (SNPsplit using species-specific SNV positions). For hybrid WGBS samples (DA and CNCC), on average, 48.2% ± 0.2% of all aligned reads are unassignable using SNPs between human and chimpanzee genome, 25.9% ± 0.2% of the reads are specific to human, and 25.1% ± 0.2% of reads are specific to chimpanzee. For hybrid RRBS samples (IPSC, SKM and HEP), on average, 88.4% ± 0.3% of all aligned reads are unassignable using SNPs between human and chimpanzee genome, 5.3%±0.1% of the reads are specific to human; 5.3%±0.1% of reads are specific to chimpanzee. We have added information above to the main text. Per sample splitting reports containing the exact number of reads assignable to each of human and chimpanzee are provided as a comprehensive table at Supplemental File 1. The lower assignment rate in RRBS is expected, and we have performed two additional analyses to demonstrate why. First, the reduced representation strategy concentrates coverage in CpG-dense promoters that are highly conserved between human and chimpanzee and therefore SNV-poor, while the short MspI fragments that dominate these libraries frequently fail to reach an informative SNV even when one is nearby. Quantifying this directly: among the 16,845,376 CpG positions covered by the union of all unphased hybrid RRBS libraries, 65.1% contain a human–chimpanzee SNV within ±50 bp (the reach of a typical RRBS read), compared with 90.8% within ±150 bp (the reach of a typical WGBS read pair) — a 1.40-fold difference in SNV accessibility at the very same CpGs. Second, we compared the aligned-length distributions of allele-resolved and unassigned reads across all ten hybrid libraries (Author response image 2). In the four WGBS libraries the two distributions are indistinguishable, confirming that read length is not driving mappability. In contrast, for all six RRBS libraries, allele-resolved reads are consistently longer than unassigned reads, with the effect reproducible across every cell type and replicate.
Author response image 2.
Aligned read length determines allele-assignment success in RRBS but not in WGBS. Aligned read lengths were extracted from the Bismark-aligned BAM files produced by phasing all ten hybrid bisulfite libraries: four WGBS libraries (CNCC and DA, two replicates each; left) and six RRBS libraries (HEP, iPSC and SKM, two replicates each; right). For each library, reads assigned to either the human (genome1) or chimpanzee (genome2) alleles were pooled into a single phased set (blue) and compared with the reads that could not be phased (grey); distributions were computed from subsampled reads and are shown as boxplots (box, interquartile range; line, median; whiskers, 5th–95th percentiles). In the WGBS libraries, phased and unassigned reads have effectively identical length distributions (median 150 bp for both; means 147.4–147.8 vs 142.1–143.1 bp), indicating that read length does not drive mappability in WGBS. In the RRBS libraries, which are dominated by short MspI fragments, phased reads are consistently longer than unassigned reads across every cell type and replicate (medians 70–75 vs 49–50 bp; means 80.5–85.7 vs 58.6–60.6 bp, ~1.4-fold). Because a read can be assigned to a parental allele only if it spans an informative human–chimpanzee SNV, these results show that the short fragment length characteristic of RRBS — together with its enrichment for SNV-poor, evolutionarily conserved CpG-dense promoters — accounts for its lower allele-resolution rate relative to WGBS.
(6) Line 103: Hybrid/parental line isn't noted in the PCA. Is this just the parental samples?
We clarify that Figure 1C shows both parental and hybrid samples, and we have updated the figure caption for Figure 1C to note that both hybrid and parental samples are plotted in the PCA. The parent/hybrid stratifications are shown in Figure 1—figure supplement 1 and referred to in the main text.
(7) Line 149: No citation # is given for the Hallgrimsdottir paper.
Corrected. Citation number 50 (Hallgrímsdóttir et al., 2024) has been added.
(8) Line 167-169: Some explicit test here would be useful. Is this more than we'd expect just because the majority of CpG sites have conserved methylation levels? How much more do divergent CpG sites cluster than expected by chance?
We agree that an explicit test of clustering would be informative, and we want to be clear about what our analysis does and does not establish. The changepoint algorithm is not a test of non-random clustering: it detects shifts in the local composition of regulatory classifications along the genome and segments each chromosome into locally homogeneous stretches. Its purpose here is enrichment rather than inference, because it selects regions in which neighboring CpG sites share both a regulatory classification and a consistent direction of species bias, so that the downstream motif-enrichment and CpG-SNV proximity analyses operate on interpretable units rather than on mixtures of mechanisms. Because the segmentation is not compared against a null model, it cannot by itself establish that divergent sites co-localize more than expected given that 83–93% of all sites are conserved. We have therefore revised the text so that Figure 2D reads as a descriptive summary of the neighbourhood composition of each regulation group, and removed any implication that the co-localization has been tested against a chance expectation. Asking whether divergent sites cluster more than expected is a genuinely different question from the one our DMR-calling addresses and answering it well would require a dedicated null model. We think this is a worthwhile analysis and a natural extension of this framework, but it is separate from the claims we make here, and we have not attempted it in this revision.
(9) Line 186-187: It should be made clear that you looked to cis, trans, and cis + trans DMRs independently.
We have revised this sentence to make explicit that cis-DMRs, trans-DMRs, and cis+trans DMRs were identified independently using the changepoint detection method applied separately to each regulatory class.
(10) Line 190-192: Some quantification of the degree to which cis effects exceed trans effects would be useful. What proportion of total divergence (e.g. mean and s.d.) is explained by cis factors?
We have added this quantification: “At FDR < 0.05, cis-regulation accounted for a mean of 91% of divergent sites and trans-regulation a mean of 4.5% across cell types, and cis remained the dominant category at every FDR cutoff tested (FDR < 0.25–0.01; Figure 2C, Figure 2—figure supplement 1–2, Supplemental Files 1–2).”
(11) Line 194-196: It should be made clear that motif enrichment was done in the human genome, right? Are the results consistent if motif enrichment was done in the chimpanzee genome?
We have clarified in the Methods that HOMER motif enrichment was performed using the human genome (hg38) as background. Repeating the analysis using the chimpanzee genome as background is a valuable future direction; we acknowledge this has not been formally tested.
(12) Line 208: For TFs other than FOXM1 and FOXA2, is TF expression generally associated (positively or negatively) with trans DMRs favoring the chimpanzee or human lineage? An idea of the distribution would be useful.
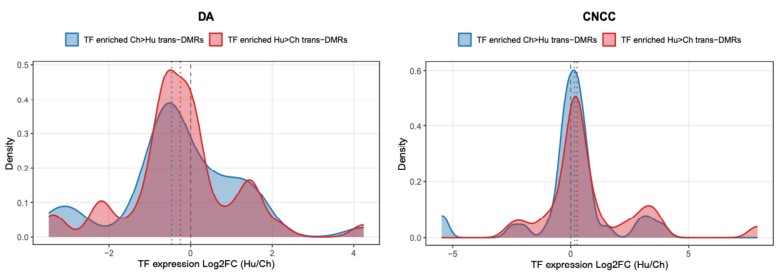
We plotted the distribution of differential TF expression for those with predicted binding sites enriched in Hu>Ch trans-DMRs versus Hu<Ch trans-DMRs in DA and CNCC. In neither cell type do the two distributions show a clear separation of directional shift. TF expression differences are broadly overlapping regardless of whether the associated trans-DMR favors the human or chimpanzee lineage. We speculate the lack of separation reflects multiple trans-acting inputs shaping methylation divergence such that single TF expression does not predict it. Aggregating across TFs with potentially opposing effects could further contribute to this observation as well (Figure 3—figure supplement 1). FOXM1 and FOXA2 are individual cases where a suggestive relationship was visible rather than evidence of genome-wide pattern.
Author response image 3.
Distribution of differential expression of TFs with predicted binding sites enriched in trans-DMRs. Density distribution of TF expression difference in human versus chimpanzee parental samples. There is a lack of separation between expression of TFs with predicted binding sites enriched in Hu>Ch trans-DMRs versus Hu<Ch trans-DMRs, in both DA and CNCC.
(13) Line 211-212: Stats are needed.
This statement is intended as a qualitative description rather than a quantitative statement. With only 4 cell types per comparison (Figure 3B), we do not have enough statistical power to establish a significant correlation, therefore we present this result as an exploratory observation rather than a statistically significant finding. We have therefore removed "consistent with this expectation," reframed the FOXM1 and FOXA2 results as descriptive observations from individual factors, and added an explicit statement that they are exploratory and hypothesis-generating rather than evidence of a genome-wide pattern.
(14) Figure 3C: Direction is not given. It should be made clear that this is a gain/loss in humans.
We have updated the Figure 3C caption to explicitly label the three SNV categories as: CpG gains in humans (human allele creates a CpG), CpG losses in humans (human allele disrupts a CpG), and no CpG change.
(15) Figure 3C: Most cell types have a bias towards increased DNA methylation when there are no nearby CpG sites (gray bars). Why? Is this a consequence of a reference bias?
We thank the reviewer for raising this. The grey bars correspond to methylation levels of conserved CpG sites near SNVs with no CpG-altering substitution and serve as the genome-wide background/control category, against which the substitution-containing categories are compared. Their modest skew toward higher methylation reflects a global offset shared by all categories rather than a substitution-specific effect. We suggest two non-exclusive explanations for this baseline offset: a genuine genome-wide difference in the distribution of human- versus chimpanzee-biased methylation, and/or a possible contribution of reference genome mapping bias arising from alignment to the human genome. Importantly, this does not affect the conclusions drawn from Figure 3C. Because the genome-wide offset is shared across all categories, the substitution-attributable signal is reflected in the difference between the CpG-gain/loss categories and the no-change (grey) baseline, and any genome-wide baseline shift — biological or technical — cancels in that comparison. We therefore interpret the grey-category asymmetry as a background property and explicitly do not attribute it to the substitutions themselves. Future work such as analyzing with reads mapped to the chimpanzee or a masked consensus genome or restricting to mappability- and coverage-matched regions could directly quantify any reference-bias contribution, and we note these as promising directions.
(16) Line 258-269: Figure 3D is not referenced in the text.
We have added a reference to Figure 3D in the relevant paragraph of the Results: “To test this, we compared the genomic distance between each DMR and its nearest CpG SNV. Consistent with our model, we found consistently shorter distances for cis-DMRs than trans-DMRs across all cell types examined: Median distances to the nearest CpG SNV were 24 ± 6 bp for trans-DMRs vs. 11 ± 2 bp for cis-DMRs (Figure 3D; Mann-Whitney p < 0.001 for all comparisons) [65].”
(17) It is unclear why Figure 4A-C focus exclusively on cis-regulated promoters. Is this for biological or technical reasons?
Both. Biologically, cis-regulated promoters are the most interpretable for assessing cell type-specificity, because cis effects are allele-intrinsic and not confounded by differences in trans-acting environments across cell types. Technically, trans-regulated promoters show methylation differences that depend on the trans-environment, making cross-cell-type comparisons less straightforward.
(18) Line 371: How many DMRs are being considered?
We have added the total number of DMRs (promoters) considered in the sign test analysis: 6,283.
(19) Line 371-372: What is the ASM/ASE concordance test? I thought you were restricting the analysis to genes with a negative association between ASM and ASE (lines 366-367), so this needs to be clarified.
We have clarified this in the text. The two-step procedure works as follows: (1) a binomial sign test is applied to all genes with promoter ASM to identify gene sets with directional bias in methylation; (2) separately, a binomial sign test is applied to the subset of genes where ASM and ASE show a negative (repressive) relationship. Gene sets that pass both steps are reported as candidates. The "ASM/ASE concordance test" refers to step 2. We have revised the text to make this two-step logic clearer.
(20) Line 379: It may be worth mentioning that these are the DMRs which are most likely to be functionally relevant in shaping expression levels.
We have added this sentence: " This subset represents cases where methylation changes are most likely to have a simple and direct repressive effect on transcription, filtering out more complex regulatory scenarios where methylation and expression changes may be uncoupled or subject to competing regulatory influences."
(21) Line 387: The test here needs to be clearer. Does a significant result mean an enrichment of differences in that gene set, or a bias in the ratio of Hu/Ch differences?
We have clarified: a significant result from the binomial sign test indicates a statistically significant bias in the ratio of human-biased to chimpanzee-biased changes within a gene set, relative to the genome-wide background ratio. It does not test for enrichment of the number of differences, only for non-random directionality.
(22) Line 403: Why the focus on expression, when the rest of the paper is focused on the methylation patterns?
Gene expression is the most direct functional readout of promoter methylation changes. The two-step sign test uses expression data in the second step precisely because it allows us to identify cases where methylation divergence has a demonstrable downstream consequence on transcription, which is the canonical mechanism by which promoter methylation affects phenotype. We have added a brief justification of this rationale to the text.
(23) Line 456: Not clear where there is actually evidence of lineage-specific selection.
We have added an explicit sentence in the Discussion describing what the evidence consists of: "Specifically, the evidence rejecting a neutral null model of cis-regulatory evolution consists of statistically significant directional bias in both promoter methylation and gene expression within functionally coherent gene sets, assessed using a two-step binomial sign test with permutation-based FDR correction." This constitutes direct evidence that the implicated gene sets are under lineage-specific selection; the separate question of which specific human phenotypes that selection shaped remains inferential and is framed as such throughout.
(24) Line 457-459: I think this line needs to be further explained: "Our use of hybrid cell lines was critical to this discovery, as it allowed us to isolate cis-acting regulatory changes from confounding trans-acting and environmental effects." Specifically, it's not apparent why cis-regulation is important for demonstrating evidence of selection.
We have added an explanation: "Isolating cis-acting changes is critical because the sign test requires that each promoter represents an independent observation; in hybrid cells, each allele's methylation is determined by its own cis-regulatory sequence, making observations across promoters genuinely independent and thus satisfying the assumptions of the binomial test."
(25) Line 460-465: The concluding claims throughout this paragraph appear to be overstated.
We have revised the concluding paragraph of the Results and the Discussion conclusion to soften the language.
(26) Line 487: Provide the actual numbers instead of saying "substantial".
We have replaced "substantial numbers of allele-specifically methylated promoters" with the actual count: 6,283 allele-specifically methylated promoters across all cell types.
(27) Line 502: I question this interpretation. While it could be that there is a shared mechanistic basis, it could also be that the cis effects tend to be larger than the trans effects, providing additional power to identify strong correlations.
We agree and have added this alternative explanation explicitly to the Discussion (see response to public review comment above).
(28) Line 510: But the results section states that it's not possible to interpret these as lineage-specific selection.
The caveat at lines 399–401 applies specifically to DPSCs, not to hybrid cell types. We have revised the text to make this distinction unambiguous.
(29) Line 601: What coverage was the methylation data?
We have added sequencing coverage and the number of CpG sites assayed below “Bisulfite-seq library preparation, sequencing and mapping” section in Methods. WGBS libraries achieved a mean coverage of 9.68× per CpG site, covering 43.6M unique CpG positions in CNCC (hybrid) and 43.4M in CNCC (parental), 41.9M in DA (hybrid) and 38.8M in DA (parental). RRBS libraries achieved a mean coverage of 5.02× per CpG site, covering 5.0M, 4.8M, and 4.5M unique CpG positions in the hybrid HEP, IPSC, and SKM libraries respectively, and 3.3M, 3.4M, and 3.2M in the corresponding parental libraries. The total number of CpG sites (union) of all WGBS samples is 48,994,320 sites, and the union of all CpG sites of RRBS samples is 7,289,251. The union of all samples (including WGBS and RRBS) is 49,049,052. We have also included coverage information per sample as a table in Supplemental File 1.
(30) Line 820: citation shouldn't include "preprint at".
Corrected. "Preprint at" has been removed from all published paper citations in the reference list.
Reviewer #2 (Public review):
This manuscript investigates the causes and consequences of human-specific DNA methylation divergence relative to chimpanzees... This study provides a valuable dataset and a compelling framework for understanding how local sequence variation contributes to epigenetic and transcriptional divergence, with likely broad impact in comparative and evolutionary genomics.
We thank Reviewer 2 for this positive assessment and for the constructive suggestions.
Although the authors identify transcription factors associated with differential methylation, it is unclear what proportion of differentially methylated CpGs or DMRs can be attributed to these factors. Providing a quantitative estimate would help assess the relative contribution of trans-acting regulation.
We agree that a quantitative estimate of the proportion of differentially methylated CpGs or DMRs attributable to these transcription factors would be informative in principle. In practice, however, such an estimate is challenging to produce reliably: predicted binding sites are not all occupied or functional, individual DMRs are typically influenced by multiple trans-factors, and we lack the per-site functional data needed to assign methylation differences to specific TFs with confidence. More importantly, even if we could generate such a number, an association-based estimate would not establish that these factors causally drive the observed methylation differences. We have added a note to the main text clarifying that our analysis identifies candidate trans-acting factors associated with differential methylation rather than quantifying their causal contribution.
The analysis of CpG-disrupting mutations is interesting but raises two concerns. First, other classes of variants—such as transcription factor binding site-disrupting mutations—could also influence local methylation patterns and are not considered here. Second, the causal direction remains ambiguous: CpG-disrupting mutations may result from methylation-associated mutational processes (e.g., C->T transitions at methylated CpGs) rather than being the primary drivers of methylation divergence.
We have addressed both concerns in the revised manuscript. On the first point, our goal was not to suggest that CpG-disrupting variants are the only causes of local methylation divergence. We now explicitly acknowledge in the Results that TFBS mutations and other variant classes could also contribute to cis-methylation divergence and represent an important avenue for future investigation. On the second point: while CpG-disrupting mutations are indeed expected to be enriched in highly methylated regions, they would be expected to associate with methylation level rather than methylation divergence, and thus cannot explain the patterns we observe.
Regarding the discussion comparing the distance between CpG-disrupting SNVs and trans-DMRs, without information on the absolute or relative distance distributions, it was difficult to assess the magnitude of the observed differences. Moreover, trans-DMRs, by definition, are not driven by local (cis) variation, and the lack of proximity to CpG-disrupting SNVs is expected. Clarifying what additional insight this analysis provides beyond this expectation may improve this section.
We agree that the lack of proximity of trans-DMRs to CpG-disrupting SNVs is expected. We have revised the text to clarify that this analysis serves as an affirming result: it is consistent with the fact that cis-DMR are under local sequence-driven regulation, and that the CpG-disrupting SNV mechanism is more closely associated to cis-DMRs than trans-DMRs. The quantifications for distance distributions are shown in Figure 3D, and we have added a sentence noting the median distances for trans-DMRs vs. cis-DMRs: 24 ± 6 bp vs. 11 ± 2 bp.
One potential extension would be to examine whether the same cis-acting SNVs are consistently associated with methylation differences across multiple cell types.
We thank the reviewer for this suggestion and have performed this analysis below. For each of the three regulatory region classes (promoters, enhancers, CTCF binding sites), we intersected CpG SNVs (±100 bp window) with cis-classified DMRs (pure_cis or cis_plus_trans at BH-corrected FDR < 0.05) across the five cell types (CNCC, DA, HEP, IPSC, SKM), and counted the number of cell types in which each SNV overlapped a cis-DMR. To assess significance, we compared this distribution to a permutation null in which, for each cell type, we randomly sampled the same number of regions from that cell type's pool of tested-but-conserved regions of the same class (1,000 permutations); SNVs were restricted to those falling within the tested universe across cell types.
Local methylation effects of CpG SNVs were shared across cell types substantially more than expected by chance in all three region classes. The observed mean number of cell types sharing per SNV-in-cis-DMR was 1.244 vs. 1.077 ± 0.006 in the null for promoters, 1.133 vs. 1.042 ± 0.001 for enhancers, and 1.171 vs. 1.061 ± 0.002 for CTCF binding sites (all p < 0.001). Fold-enrichment scaled sharply with the degree of sharing: at the highest sharing level (cis-DMR in all five cell types), observed counts exceeded the permutation null by ~3,500-fold for promoters, ~800-fold for CTCF, and ~700-fold for enhancers. The slightly stronger consistency signal at promoters relative to enhancers is consistent with the more constitutive activity of promoter elements across cell types. These results indicate that the same cis-acting variants tend to drive methylation divergence across multiple cell types, supporting a shared mechanistic basis for cis-methylation divergence. We have added the figure in the main text as Figure 3—figure supplement 2.
Regarding their two-step sign test analysis, because enrichment-based approaches can sometimes overemphasize statistical significance without reflecting effect size, I wonder if incorporating the magnitude of methylation change would provide additional information.
We agree. The magnitude of methylation change (effect size) for each gene and gene set is now provided in Supplemental File 7 alongside the directional bias statistics. We have added a sentence to the Results pointing readers to this resource.
Strength:
I recommend that the authors provide a list of cis-cis-regulated promoters and their associated genes, which would be a valuable resource for the field.
We have added this list as Supplemental File 8.
Reviewer #3 (Public review):
Ma et al. use human-chimpanzee tetraploid cells to examine species differences in DNA methylation... Both identified SNVs and transcription factors are good candidates for future experimentation. Further, they find that cis-DMRs are more highly correlated with cis-expressed genes than trans-DMRs with trans-expressed genes, providing evidence that methylation and expression are linked genome-wide.
We thank Reviewer 3 for this summary and for the detailed recommendations.
Weakness
(1) Strengthening their cis/trans analysis, including: (a) only showing or analyzing genomic regions that pass FDR correction; (b) clarifying how cis genes are defined (Figure 2B shows some genes labeled as cis where the direction-of-effect differs between hybrid and parent cells); (c) assessing how well powered they are to perform each analysis.
(a) Figure 2B has been updated to show regulatory classifications of promoter regions in cranial neural crest cells (CNCCs) at FDR < 0.05. Scatter plots and bar plots for all cell types at the level of individual CpG sites have been moved to Figure 2—figure supplement 1, and the corresponding promoter-level plots for all cell types other than CNCCs to Figure 2—figure supplement 2. We have clarified in the Figure 2—figure supplement 1 caption that nominal p-values are used to preserve the full dynamic range of the data, whereas FDR-corrected thresholds are applied for visualization of promoter scatter plots as well as all formal inference and for reporting significant candidate loci. FDR-corrected results are presented in Figure 2—figure supplements 1–2, and we have added explicit statements in the Results confirming that the cis: trans ratio is stable across FDR thresholds.
(b) We have clarified the definition of cis-regulated genes in the text: cis-regulated genes are defined as those where the direction of allelic difference is consistent between hybrid and parental samples for both methylation and expression. We have verified that this definition is applied consistently throughout the manuscript and downstream analyses.
(c) We have clarified the FDR correction approach for the sign test in the Methods: FDRs are estimated by permutation (10,000 permutations), and we report results at FDR < 0.25 for the two-step test with supporting evidence from the methylation-only sign test (nominal p < 0.05). We acknowledge that this is a relatively liberal threshold. The sign test itself provides direct evidence that the implicated gene sets are under lineage-specific selection; what we have toned down is the downstream interpretation, framing the link between these gene sets and specific human phenotypes as inferential and requiring experimental validation rather than as confirmed.
(d) We agree that experimental validation would strengthen the mechanistic claims. We have added this explicitly to the Limitations section: "definitive demonstration of causality requires targeted experimental perturbations such as base editing (for CpG-disrupting SNVs) or TF knockdown/overexpression experiments (for trans-acting TFs)."
(2) Softening claims about human evolution or human specificity for several reasons: (a) Their comparison lacks tetraploid controls (e.g. human-human tetraploids and chimp-chimp tetraploids) or experimental follow-up in diploid cells, making it hard to be certain that observed effects are not due to ploidy. (b) There are no outgroup species included in the analysis. (c) The use of no or very loose FDR corrections with the sign test makes it difficult to draw conclusions. (d) Experimental data to link SNVs to changes in cis methylation or identified transcription factors to changes in trans methylation would be needed to validate the authors' predictions.
(a) The concern about ploidy effects is noted. We note, however, that the primary evidence for cis-regulation comes from allele-specific methylation within the same tetraploid nucleus, where both alleles experience identical ploidy and trans-environments. Ploidy effects would be expected to affect both alleles equally and would therefore not produce the allele-specific differences we observe. We acknowledge that single-species tetraploid controls would provide additional confidence and represent a valuable future experiment.
(b) We have added the absence of an outgroup species as an explicit limitation in the Discussion.
(c) We have clarified the FDR correction approach for the sign test in the Methods: FDRs are estimated by permutation (10,000 permutations), and we report results at FDR < 0.25 for the two-step test with supporting evidence from the methylation-only sign test (nominal p < 0.05). We acknowledge that this is a relatively liberal threshold and have emphasized this by adding a new sentence: “However, as indicated by the FDR, we do expect some fraction of these candidate gene sets to be false positives.”
(d) We agree that experimental validation would strengthen the mechanistic claims. We have added this explicitly to the Limitations section: "definitive demonstration of causality requires targeted experimental perturbations such as base editing (for CpG-disrupting SNVs) or TF knockdown/overexpression experiments (for trans-acting TFs)."
Reviewer #3 (Recommendations for the authors):
(1) Why are dental pulp stem cells so different from the other cell types transcriptionally (e.g. Figure 1C)? Is this due to being primary cells vs. stem-cell-derived cells?
The transcriptional distinctiveness of DPSCs is most likely attributable to their status as primary cells rather than iPSC-derived cells. Primary cells retain the epigenetic and transcriptional signatures of their tissue of origin and have not undergone reprogramming, whereas iPSC-derived cell types share a common pluripotent origin that may reduce inter-cell-type transcriptional distance. Additionally, DPSCs are mesenchymal stem cells with a distinct developmental lineage and were obtained from adult donors rather than differentiated in vitro, which may further contribute to their distinct profile. We have added a brief note to the Results acknowledging this.
(2) I am concerned about how cis genes are defined. In Figure 2B, there are genes labeled as cis, where the direction-of-effect differs between hybrid and parent cells. I believe cis should only include genes with the same direction-of-effect between hybrid and parent cells, as illustrated in Figure 2A. This fix should propagate through the ensuing figures and results.
We have clarified the definition of cis-regulated genes in the text (see response to Weakness 1b above). The classification framework assigns a site to "cis" when the allele effect test is significant in hybrids and the System × Allele interaction term is not significant, meaning there is no detectable change in the allelic difference between the hybrid and parental systems. Sites where the allelic difference genuinely differs between systems — that is, where the interaction term is significant — are classified as cis × trans (interactive) or cis + trans (additive) rather than pure cis, depending on whether the two systems disagree in direction or only in magnitude.
We note that Figure 2B plots parental and hybrid methylation differences as the per-sample average difference in fractional methylation, which is used for visualization only. Points labeled cis that fall on the opposite side of the y = x diagonal are an artifact of this averaging: where the underlying difference is close to zero, the coverage-weighted per-sample average can flip sign even though the beta-binomial model, which fits the read counts directly and accounts for coverage and overdispersion, finds no significant interaction. The regulatory classification is based on the model, not on the sign of the averaged difference, so a small amount of scatter around the diagonal is expected. We have verified that this definition is applied consistently throughout the manuscript and downstream analyses and have clarified the caption of Figure 2B to make this explicit.
(3) Are you equally powered to detect cis and trans effects?
At the single-CpG level, the two hypotheses do differ in statistical power, but at the regional level this difference is mitigated by the higher effective read depth, and we now state this explicitly in the revised manuscript.
The first hypothesis in our classification framework tests allele-specific methylation directly, whereas the second hypothesis includes an interaction term that evaluates whether allelic differences shift between the parental and hybrid systems. Because the interaction test is inherently less powerful, it requires greater sequencing depth and, ideally, additional replicates to yield comparably confident estimates and to assign sites to certain classification categories with significance. As a consequence, at the single-CpG level, trans effects are more sensitive to FDR thresholds than cis effects of equivalent nominal significance, which reduces our power to detect them. At the regional level, however, as well as in CpG-level analyses with high-coverage samples, this disparity in power between cis and trans largely disappears.
This is the technical component of the issue. From a biological standpoint, cis effects are also intrinsically easier to detect than trans effects: estimates of trans effects necessarily incorporate not only trans-acting molecular mechanisms but also environmental and technical noise, so cis estimates will always be cleaner. This is a well-recognized limitation of existing cis/trans classification frameworks, and we acknowledge this limitation in the discussion and have added suggestions in experimental set-up to mitigate it. To address the reviewer's concern directly, we have performed a formal power analysis quantifying the relative power to detect cis and trans effects as a function of read depth (See Author response image 1).
(4) Are the results shown for SNVs in CpGs in Figure 3C only for cis-DMRs or for all DMRs? If the latter, please show cis-DMRs and trans-DMRs separately and explain why trans-DMRs show the same pattern as cis-DMRs. In addition, I would expect that the CpG that contains an SNV leading to CpG loss or gain would be the most affected in terms of methylation status, rather than CpGs within 25bp vs. 50bp vs. 100bp. It would be helpful to see that plot as well.
We thank the reviewer for the opportunity to clarify. Figure 3C is not an analysis stratified by cis-DMRs or trans-DMRs. Rather, it examines local methylation changes at conserved CpG sites located within 25 bp, 50 bp, and 100 bp of a CpG-disrupting SNV. The purpose of this analysis is to test a specific mechanistic hypothesis: that a CpG-disrupting mutation may influence the methylation status of nearby, intact CpG sites in cis. The analysis is therefore agnostic to cis/trans-DMR classification, as it asks a different question, namely whether sequence disruption at one CpG propagates locally to neighboring CpGs.
We note that Figure 3D addresses a related but distinct question, showing that cis-acting sequence changes more broadly (not restricted to CpG-disrupting mutations) are more strongly associated with cis-DMRs than with trans-DMRs. Together, Figures 3C and 3D support complementary aspects of the cis mechanism: the local propagation of methylation changes around disrupted CpGs (3C) and the broader association of sequence variation with cis-DMRs (3D).
Regarding the reviewer's second point: we agree that the CpG site directly disrupted by the SNV would itself be the most affected, by definition, since the CpG dinucleotide is destroyed (in the case of CpG loss) or newly created (in the case of CpG gain). Because methylation cannot be measured at a CpG that no longer exists (or has only just been created on one allele), this site cannot be included in a comparative methylation analysis across alleles or species. The 25/50/100 bp windows were therefore chosen specifically to test the local effect on conserved, measurable CpGs surrounding the disruption. We have clarified this rationale in the revised text/figure legend.
(5) The finding that cis-DMRs and cis-expressed genes are more correlated than trans-DMRs with trans-expressed genes is nice to see. What is a potential explanation for why the patterns across the genomic interval surrounding the TSS are so different across cell types, and even positively correlated near the TSS in dopaminergic neurons? Why do you not see a difference between cis and trans in CNCCs? In addition, it would be nice to see the correlation between cis-DMRs and trans-expressed genes, and vice versa, as a control for these plots.
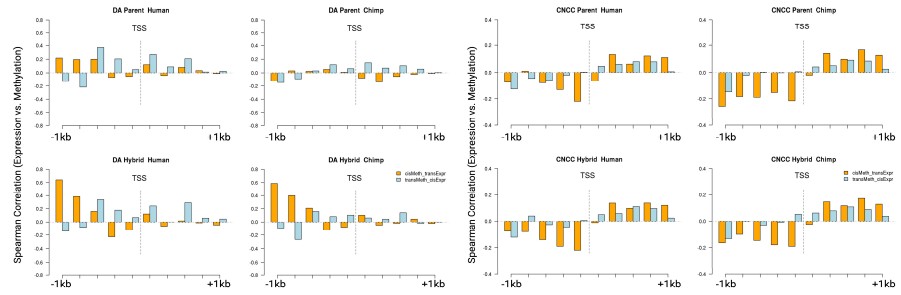
We have added the suggested control analysis. For the cis-DMR/trans-expressed-gene and trans-DMR/cis-expressed-gene sets in both DA neurons and CNCCs, the correlations around the TSS are less consistently negative than for the cis-DMR/cis-expressed-gene set. In both cell types, cis-methylation and cis-expressed genes show the strongest opposing (negative) relationship to one another, which supports the specificity of the cis–cis coupling reported in Figure 4G. Regarding why the correlation profiles across the TSS-flanking interval differ so markedly across cell types—including the positive correlation near the TSS in dopaminergic neurons—and why the cis–trans distinction is less pronounced in CNCCs, we are not able to offer a confident explanation. The variation may reflect cell-type-specific regulatory architecture, but a great deal remains unknown about how methylation and transcription are coupled in a cell-type-specific manner, and our four cell types do not allow us to distinguish among the possible explanations. We think this is an open and interesting question, and that analyzing additional cell types with matched WGBS and gene expression data would be the most informative way to establish how general these patterns are and what drives the between-cell-type variation. We have noted this explicitly in the main text.
Author response image 4.
Spearman correlation of expression and methylation for CNCC and DA for subsets of genes with cis-regulated methylation and trans-regulated expression (orange), as well as genes with trans-regulated methylation and cis-regulated expression (blue). Two kb surrounding each transcription start site (TSS) is shown, split into 10 bins of 200 bp where individual CpG sites are pooled and averaged as fractional methylation values and correlated with expression values of the neighboring genes (in TPM).
(6) The use of the sign test to identify pathways with the same direction of effect is a great approach. However, I am concerned with the use of no or very loose FDR corrections (e.g. FDR < 0.25 in line 372 and no FDR correction in line 374). Combined with Figure 6, where many of the signals appear to be weak or driven by a few genes (e.g. highly arched eyebrow and poor speech), it makes it difficult to draw robust conclusions. It is notable that the strongest signal is seen in DPSCs, which the authors note contains experimental confounds. We also think that the authors should tone down their biological interpretations, particularly for stem cells. For instance, COLEC11 is involved in neural crest cell migration but is identified from the iPSC analysis and not the CNCC analysis. Why not?
We have added a sentence to emphasize the possibility of some false positive sign test results (“However, as indicated by the FDR, we do expect some fraction of these candidate gene sets to be false positives”), and we have toned down the biological interpretations accordingly.
We want to clarify that the sign test directly demonstrates that these gene sets are under lineage-specific selection. We have clarified that the test does not establish a definitive link between these gene sets and specific human phenotypes; that link is inferential and would require experiments or further validation, and we have toned down the biological interpretations accordingly.
Regarding COLEC11: in response to this comment, we directly examined COLEC11 expression and methylation in CNCCs and found that it is in fact significant in this cell type. In CNCC hybrid cells, COLEC11 shows significant chimpanzee-biased allele-specific expression (log2 fold change [human/chimpanzee allele] = –2.45; DESeq adjusted p = 0.005), together with significant human-biased methylation (fractional methylation [human – chimpanzee] = 14%; adjusted p < 0.001). The direction of this divergence is therefore consistent with IPSC. The reason COLEC11 did not surface at the pathway level in CNCCs is that other genes in the same pathway contribute to the directional signal for that cell type; we would not expect every individual gene to emerge in the cell type where its pathway is most relevant. We have added a note making this point and cautioning against over-interpreting any single gene example.
(7) We appreciate that the authors provide a careful list of limitations of their study. In addition to the limitations listed, the authors should also include that experiments would be needed to validate that SNVs disrupting or creating CpGs affect methylation.
We have added this to the Limitations section: “definitive demonstration of causality requires targeted experimental perturbations such as base editing (for CpG-disrupting SNVs) or TF knockdown/overexpression experiments (for trans-acting TFs).”
(8) We also caution the authors in describing their findings as "human-specific" because there is no outgroup in this study.
We agree and have added the absence of an outgroup as an explicit limitation in the Discussion.
We thank all three reviewers again for their thorough and constructive engagement with our work. We believe the revised manuscript is improved as suggested.



