
Peer review process
Revised: This Reviewed Preprint has been revised by the authors in response to the previous round of peer review; the eLife assessment and the public reviews have been updated where necessary by the editors and peer reviewers.
Read more about eLife’s peer review process.Editors
- Reviewing EditorBernhard SchmidUniversity of Zurich, Zurich, Switzerland
- Senior EditorSergio RasmannUniversity of Neuchâtel, Neuchâtel, Switzerland
Reviewer #3 (Public review):
Combining a five-year field experiment with a global meta-analysis, Wu et al. investigate how grazing intensity influences ecosystem carbon dioxide (CO₂) fluxes in grasslands and how these effects are regulated by environmental conditions such as grazing duration, wetness index, and soil temperature and moisture responses.
The authors show that the response of net ecosystem productivity (NEP) to light grazing shifts from negative to positive along a wetness gradient, whereas heavy grazing consistently suppresses NEP across wetness conditions. Importantly, this pattern is supported by both the field experiment and the meta-analysis, suggesting that may help maintain moderate levels of grazing can potentially enhance both plant productivity and carbon sequestration under favorable moisture conditions.
The integration of experimental data with a global synthesis is a particular strength of the study, allowing the authors to evaluate grazing impacts across both temporal variability (precipitation fluctuations in the field experiment) and spatial variability (wetness gradients across global grasslands). Overall, the conclusions are well supported by the data.
Overall, the principal conclusions are generally supported by the reported results, and the study provides useful evidence that the effects of grazing on grassland carbon cycling depend on both grazing intensity and environmental context. The comparison between field and synthesis results is potentially valuable for understanding why grazing effects vary among grassland systems. However, some aspects of the meta-analysis remain insufficiently documented. In particular, the study-selection numbers presented in the new PRISMA diagram require clarification, and the manuscript does not clearly explain how individual response ratios were weighted when estimating the pooled effect sizes. Resolving these reporting and methodological issues would improve the reproducibility and interpretation of the synthesis.
Author response:
The following is the authors’ response to the original reviews.
eLife Assessment
This study combines a five-year field experiment with a meta-analysis to quantify the effects of grazing on ecosystem CO2 fluxes as modified by wetness. The results of this study are potentially valuable, but the Methods description is incomplete and compromises reproducibility and interpretability. A major caveat of this study is that the assessment of CO2 fluxes in time and space is not complete.
We appreciate the comments. The incomplete assessment of CO2 fluxes in time and space has been added in the Limitations and implications for future study Section in the revised manuscript. Method description has been revised as follows:
Lines 205-215, page 7: “Four grazing rotations were conducted each year from 2019 to 2023 in the field study. Before each grazing rotation, two cages (1.2 m × 1.2 m × 1.2 m) were installed in each plot to ensure that the vegetation inside would not be foraged by sheep. Aboveground plant biomass was collected after the end of each grazing rotation. Specifically, in each plot, five 1 m × 1 m quadrats were placed. All aboveground biomass within these quadrats was clipped at ground level and then oven-dried at 65 °C for 48 h to determine the community-level dry biomass. The plant species were classified into C3 and C4 groups (Table S1). Belowground biomass (BGB) was quantified by collecting root biomass using soil core with diameter of 7 cm each September from 2019 to 2023 (Fig. S2). Specifically, two soil cores were collected from each 1 m × 1 m quadrat corresponding to aboveground biomass measurements at depths of 0-30 cm. The belowground parts were then extracted from the soil by washing with water and oven-dried at 65 °C for 48 h to obtain dry weight.”
Lines 243-245, page 8: “The environmental predictors considered in the analysis included grazing intensity, the response ratio of soil temperature and soil moisture, wetness index, and grazing duration.”
Lines 468-470, page 15: “The assessment of ecosystem CO2 fluxes was incomplete due to limited measurement time, area and sampling intervals. This may bias the representation of seasonal cycles and spatial heterogeneity, especially in the regions that was not monitored.”
Public Reviews:
Reviewer #1 (Public review):
Summary:
This study integrates long-term (7th-11th year) ecosystem CO2 flux measurements from a continuously grazed typical steppe in Inner Mongolia with a global meta-analysis of grazing experiments (585 observations) to systematically investigate how the wetness index modulates the effects of grazing intensity on net ecosystem productivity (NEP) in grasslands.
Key findings include:
(1) Heavy grazing significantly reduced gross primary productivity (GPP) and ecosystem respiration (ER) in the typical steppe but did not significantly affect NEP.
(2) Globally, grazing significantly reduced GPP, ER, and NEP, and a higher wetness index and aboveground biomass (AGB) enhance the positive response of NEP to grazing.
(3) Under light and moderate grazing, the response of NEP to grazing was positively correlated with the wetness index, a relationship potentially mediated by a higher plant relative growth rate (RGR) in wetter years.
This study holds considerable practical significance. In the context of global change, comprehending the regulatory function of water is of great importance for the adaptive management of grasslands.
Strengths:
(1) The study cleverly combines long-term in situ observations (revealing temporal dynamics and potential mechanisms) with a global meta-analysis (testing the generality of patterns), forming a complete evidence chain from "process understanding" to "pattern verification".
(2) Focusing on the 7th to 11th years of grazing treatments avoids the common "initial disturbance effects" observed in short-term grazing experiments and truly captures the steady-state response of the ecosystem after it has reached a new equilibrium.
(3) By analyzing plant relative growth rate (RGR) and aboveground biomass (AGB), this study provides mechanistic clues regarding how the wetness index modulates grazing effects. The finding that plant compensatory growth is enhanced in wetter years is a crucial pathway explaining the variation in the NEP response.
(4) The meta-analysis systematically integrates published literature with a substantial sample size (585 observations) and broad geographical coverage (Figure 1B).
(5) The finding that light grazing promotes carbon sinks in wet years, while heavy grazing reduces productivity even in wet years, has direct implications for adaptive grassland management under climate change.
Thank you for the comments. We would like to express our gratitude for your positive and insightful evaluation of this manuscript.
Weaknesses:
Although the paper does have strengths in principle, there are weaknesses and areas for improvement in the paper. In particular:
(1) Incomplete mechanistic chain: While RGR and AGB data offer valuable clues for mechanistic interpretation, the causal chain from "increased wetness → higher RGR → maintained NEP" remains incomplete. Key intermediate processes, such as soil moisture dynamics, nutrient availability, changes in community composition, and leaf photosynthetic physiological parameters, are absent, making the mechanistic explanation somewhat speculative.
Thank you for the comments. The data of the soil moisture dynamics, composition of C3 and C4 plant communities and their species richness have been supplemented to complete the mechanistic chain. However, the structural equation modeling could not be set up if C3 and C4 plant communities were included (Fig. S8). Leaf photosynthetic physiological parameters were not collected in this study. We have made following changes in the revised manuscript:
Lines 339-341, page 11: “In addition, the structural equation model showed that grazing altered net ecosystem productivity by increasing soil temperature and relative growth rate, while decreasing aboveground biomass of plants (Fig. S8).”
Lines 472-474, page 15: “Furthermore, key intermediate processes, such as soil nutrient availability, changes in community composition, and leaf photosynthetic physiological parameters, should also be investigated in the future.”
(2) Inadequate exploration of heterogeneity: The global meta-analysis reveals significant effect heterogeneity. Currently, only a few moderators, such as wetness index, precipitation, and temperature, are analyzed. Potential moderators, including grazing history, grassland type (typical steppe/alpine meadow/savanna), livestock type (cattle/sheep/mixed), and soil type, are not adequately explored.
Thank you for the comments. Grazing duration was presented in Fig. S13. The heterogeneity analysis of grassland types and livestock types was supplemented as Fig. S11 and Fig. S12 in the Supplementary documents. We have also made following changes in the revised manuscript:
Lines 367-370, page 12: “Grazing decreased GPP, ER and NEP in desert and temperate grassland, but had no significant effect on GPP, ER and NEP in alpine grassland and savanna (Fig. S11). In addition, cattle and sheep grazing decreased GPP and NEP, but livestock mixed grazing did not show significant effect on GPP, ER and NEP (Fig. S12).”
(3) Integration of long-term experiment and meta-analysis could be tighter.
Thank you for the comments. Integration of long-term experiment and meta-analysis has been revised in the revised manuscript as follows:
Lines 449-463, page 15: “Our long-term experiment and global meta-analysis jointly provided complementary evidence for understanding the effect of grazing on the ecosystem CO2 fluxes in grassland ecosystems. Long-term grazing field experiments revealed the mechanisms underlying the effects of grazing on ecosystem CO2 fluxes. Global meta-analysis further clarified the universality of these response patterns across different climatic zones and grassland types. It should be noticed that both field experiment and meta-analyses consistently revealed that wetness was an important factor in regulating the ecosystem CO2 fluxes in response to grazing. Under wetter conditions, light grazing promoted compensatory plant growth, enhanced leaf turnover and photosynthetic recovery capabilities, thereby maintaining or even enhancing the NEP (Morgan et al., 2016; Owensby et al., 2006). Conversely, under drier conditions or heavy grazing pressure, a decrease in aboveground biomass and weakened ecosystem resilience jointly limited the ecosystem carbon uptake capacity. These results suggested that wetness modulated the effects of grazing on NEP in grasslands. Moderate grazing may be sustainable under better water conditions, while heavy grazing may exceed the ecosystem resilience threshold even under relatively wet conditions, leading to sustained ecological degradation.”
Reviewer #2 (Public review):
Overgrazing in grasslands is a widespread, enormous problem, and its consequences need more research attention.
However, I have some concerns about the methods in this manuscript.
(1) The plots were grazed from May to September. For the CO2 measurements, it states growing season, and that data was collected on sunny days from 9 to 11 am. However, annual values are reported, and no details on how these were calculated. With no measurements outside of 9 to 11 am, and only on non-sunny days, and only during the growing season, I question how accurate the annual numbers are.
Thank you for the comments. The ecosystem CO2 fluxes were measured during growing season; the description of annual CO2 have been revised to “growing-season” CO2. The ecosystem CO2 fluxes were measured on sunny days during the growing season (May-September) between 9:00 and 11:00 a.m. It can represent typical daytime carbon flux dynamics during the growing season (Fan et al., 2011; Li et al., 2010). In addition, previous studies showed that the ecosystem CO2 fluxes measured at 9:00 and 11:00 a.m. represented the average ecosystem CO2 fluxes of the day (Niu et al., 2008; Rong et al., 2017; Yu et al., 2025), so we use the ecosystem CO2 fluxes measured at 9:00 and 11:00 a.m. to calculate the total ecosystem CO2 fluxes of the day. We have also revised it in the limitation for future study section. We have made following changes in the revised manuscript:
Lines 183-186, page 6: “The gas exchange measurements were conducted on sunny and calm days between 9:00 and 11:00, a time when the ecosystem CO2 represented the daily average (Niu et al., 2008; Rong et al., 2017; Yu et al., 2025), with a frequency of three times per month.”
Lines 468-472, page 15: “The assessment of ecosystem CO2 fluxes was incomplete due to limited measurement time, area and sampling intervals. This may bias the representation of seasonal cycles and spatial heterogeneity, especially in the regions that were not monitored. Multiple time-point sampling should be adopted; the sampling frequency and points should also be increased in the future field study.”
(2) This study uses one chamber, 0.5 by 0.5 m, for a total area of 0.25 m2. This is pretty small, and with no replication, I would like to see more detail on how these are placed, especially when one of the dominant species is a bunchgrass. Sampling on or off a bunchgrass will give very different readings, and neither will be representative of the entire plot. The same for the soil temp and water measurements, there is no detail on how many replicates are in each plot, and working randomly does not work when there are spatial patterns caused by the bunchgrasses in the plots.
Thank you for the comments. Two replicates of the chambers in each plot were set, and their specific sites were labeled in Fig. S2. The study area was located in a typical steppe dominated by Stipa grandis and Leymus chinensis. Therefore, we selected quadrats mainly containing these two species. We have made following changes in the revised manuscript:
Line 186-187, page 6: “In each plot, the chambers of two replicates were measured.”
(3) MAP and MAT are important in this study, and no mention is given if this data is from this site or a neighboring site, and if so, what the distance to this location is.
Thank you for the comments. The data of MAP and MAT were provided in the revised manuscript as follows:
Lines 193-195, page 7: “The precipitation and air temperature were collected from the Xilinhot Meteorological Observation Station, which was near the experimental site in this field experiment.”
(4) Vegetation was sampled in five locations in each plot. I note no detail on the belowground biomass, how many reps, what area, or which depth? This essential data is missing. The same goes for the RGR, and here the authors talk about grazing events. Whereas earlier in section 2.2, it implies continuous grazing every day during the growing season. RGR needs more details, such as how many times, its replication, etc.
Thank you for the comments. The detailed method for how to collect belowground biomass and how to calculate the RGR has been supplemented in the revised manuscript as follows:
Lines 205-215, page 7: “Four grazing rotations were conducted each year from 2019 to 2023 in the field study. Before each grazing rotation, two cages (1.2 m × 1.2 m × 1.2 m) were installed in each plot to ensure that the vegetation inside would not be foraged by sheep. Aboveground plant biomass was collected after the end of each grazing rotation. Specifically, in each plot, five 1 m × 1 m quadrats were placed. All aboveground biomass within these quadrats was clipped at ground level and then oven-dried at 65 °C for 48 h to determine the community-level dry biomass. The plant species were classified into C3 and C4 groups (Table S1). Belowground biomass (BGB) was quantified by collecting root biomass using soil core with diameter of 7 cm each September from 2019 to 2023 (Fig. S2). Specifically, two soil cores were collected from each 1 m × 1 m quadrat corresponding to aboveground biomass measurements at depths of 0-30 cm. The belowground parts were then extracted from the soil by washing with water and oven-dried at 65 °C for 48 h to obtain dry weight.”
(5) Hypothesis 2 is vague: "act as key factors". A more precise hypothesis would be better, otherwise it just leads to p-hacking.
Thank you for the comments. The misleading description has been deleted.
(6) More generally, neither hypothesis is really based on the introduction, as the authors report mixed results in the literature. Hence, the more specific hypothesis 1 reads like it is HARKED, based on the results that the authors found. This is not a good research practice. See the following papers on this topic:
Murphy & Aquinis. 2019. HARKing: How bad can cherry-picking and question trolling produce bias in published results? Journal of Business and Psychology 34:1-17
Bishop. 2019 Rein in the four horses of irreproducibility. Nature 568: 435
Fraser et al. 2018. Questionable research practices in ecology and evolution. Plos One 13:7
Parker et al. 2016. Transparency in ecology and evolution: real problems, real solutions. Trends in ecology and evolution 31:9
Thank you for the suggestion. The hypotheses have been deleted in the revised manuscript to avoid HARKED mistakes.
(7) Figure 2 mentioned n=3, which is correct. However, the variance around the means in the figures is tiny, which raises questions about the replication that is actually used here. I would like to see the entire statistics tables, including DF and sample sizes, included as an appendix, so that the reader can evaluate this much more.
Thank you for the comments. In this study, the data presented in Fig.2 were expressed as mean± standard error (SE):
In addition, we have provided the complete statistical table in Supplementary Table S2 according to the suggestion of the reviewer.
(8) Figure 3, now only low, medium, and high grazing are reported as changes from the control. This can be misleading as the reader can't see how the control varies along the various gradients. I suggest including a figure with the raw data for each as an appendix. In addition, the sample size in 3d, e, f is much higher, and it looks to me like the authors used both the reps and years together. This is not good practice. In addition, full statistics tables should be included in the appendix.
Thank you for the comments. The relationships between ecosystem CO2 fluxes and wetness index have been supplemented in Fig. S6. We have also provided the complete statistical table in Supplementary Table S3.
(9) In Table S1, since there are already a number of recent meta-analyses on this topic, I think there needs to be a stronger justification for this one.
Thank you for the comments. The results of our five-year field monitoring experiments showed that carbon fluxes and their components were significantly influenced by the wetness index. Therefore, we explored whether such effects also occur in grazing experiments at the global scale. The results demonstrated that similar patterns indeed exist worldwide, indicating that our meta-analysis is meaningful and necessary. In addition, previous studies have addressed related topics, net ecosystem productivity has mostly been treated as an auxiliary variable rather than the primary focus of investigation (Jiang et al., 2020; Shi et al., 2022; Zhang et al., 2022; Zhou et al., 2019). In previous studies, meta-analysis literatures on grazing and NEP were limited and not adequate. Our meta-analysis is more comprehensive and reflects the reliability of the results. We have made following changes in the revised manuscript:
Lines 491-492, page 16: “In previous studies, meta-analysis literatures of effects of grazing intensities on NEP were limited and not adequate.”
Lines 512-514, page 16: “In summary, the meta-analysis of this study presents the first comprehensive assessment of how annual wetness index affects the response of ecosystem CO2 fluxes to grazing across global grasslands.”
(10) Regarding the grazing-induced CO2 fluxes, these are only based on the plants and do not incorporate the animal CO2 flux, nor the animal litter CO2 flux, as they were penned at night outside the plots. Thus, the grazing impact is inflated in the data reported here and does not really represent GPP, NET, or RE. This needs to be written about in the discussion section.
Thank you for the comments. The objective of this study was to evaluate the carbon exchange processes from vegetation and soil under grazing disturbance. Thus, the grazing effects reported in this study were the vegetation-soil ecosystem scale rather than the net carbon balance of the entire grazing system. Consequently, our conclusions regarding the effects of grazing on grassland ecosystem carbon exchange remain reliable and ecologically meaningful.
We have made following changes in the manuscript:
Lines 483-490, page 16: “There are also limitations in evaluating the effects of grazing on grassland-livestock ecosystem CO2 fluxes in this study. Specifically, carbon emissions derived from animal respiration were not included in this study. Therefore, the results of the field experiment and meta-analysis in this study should not be interpreted as a complete carbon budget assessment of the grassland-livestock ecosystem. Our primary objective was to evaluate the carbon exchange processes between vegetation and soil under grazing disturbance. Thus, the grazing effects reported in the field experiment and meta-analysis of this study were responses at the vegetation- soil ecosystem scale rather than the net carbon balance of the entire grazing system.”
Reviewer #3 (Public review):
Combining a five-year field experiment with a global meta-analysis, Wu et al. investigate how grazing intensity influences ecosystem carbon dioxide (CO2) fluxes in grasslands and how these effects are regulated by environmental conditions such as grazing duration, wetness index, and soil temperature and moisture responses.
The authors show that the response of net ecosystem productivity (NEP) to light grazing shifts from negative to positive along a wetness gradient, whereas heavy grazing consistently suppresses NEP across wetness conditions. Importantly, this pattern is supported by both the field experiment and the meta-analysis, suggesting that moderate levels of grazing can potentially enhance both plant productivity and carbon sequestration under favorable moisture conditions.
The integration of experimental data with a global synthesis is a particular strength of the study, allowing the authors to evaluate grazing impacts across both temporal variability (precipitation fluctuations in the field experiment) and spatial variability (wetness gradients across global grasslands). Overall, the conclusions are well supported by the data.
However, several aspects of data acquisition, analysis, and presentation could be clarified to further strengthen the reproducibility and interpretation of the results:
(1) A PRISMA-style flow diagram would be helpful for the meta-analysis to clearly illustrate the study selection process and facilitate interpretation of the dataset.
Thank you for the comments. We have added the PRISMA-style flow diagram in the revised supplementary materials. See Fig. S9.
(2) Grazing intensity requires a clearer definition and, where possible, standardization between the field experiment and the studies included in the meta-analysis. Key parameters such as the number of stock per area, days per rotation or per year, and total years of grazing should be clearly defined. In addition, the criteria used to classify grazing intensity into LG, MG, and HG in the meta-analysis should be explicitly described.
Thank you for the comments. In our meta-analysis, the classifications of grazing intensity into light, moderate, and heavy grazing were provided in previous studies. For studies in which grazing intensity was not explicitly reported, we classified grazing intensity according to the USDA criteria (https://www.fs.usda.gov/Internet/FSE_DOCUMENTS/stelprdb5109714.pdf).
The criteria was that: light grazing: approximately equal to a maximum of 40% Utilization (grazing and trampling) of forage standing crop (current and previous years’ growth) at the end of the growing season; moderate grazing: approximately equal to a maximum of 50% Utilization (grazing and trampling) of forage standing crop (current and previous years’ growth) at the end of the growing season; Heavy grazing: greater than 50% Utilization (grazing and trampling) of forage standing crop (current and previous years’ growth) at the end of the growing season (November 15).
We have made following changes in the manuscript:
Lines 271-277, page 9 “(e) The classifications of grazing intensity (light, moderate, and heavy grazing) were primarily based on the definitions provided in the original studies. For studies in which grazing intensity was not explicitly reported, we classified grazing intensity according to the modified Grazing Intensity Classes proposed by the USDA (https://www.fs.usda.gov/Internet/FSE_DOCUMENTS/stelprdb5109714.pdf) (Yin et al., 2023).”
(3) In several sections of the manuscript, it is difficult to distinguish whether phrases such as "this study" or "our study" refer specifically to the field experiment or to the overall study, including both the experiment and the meta-analysis. Clearer wording distinguishing these components would improve readability.
Thanks for the suggestion. The specific distinctions have been revised to clarify whether they refer to the field experiment, meta-analysis or the comprehensive conclusions of the results from both field experiment and meta-analysis.
Lines 50-53, page 2: “Overall, the meta-analysis and field experiment jointly provide global perspectives on the response of ecosystem CO2 fluxes to grazing intensity and improve our knowledge of the factors influencing the response of ecosystem CO2 fluxes to grazing intensity.”
Lines 191-193, page 6: “The annual precipitation and mean annual air temperature (MAT) for the field study area from 2019 to 2023 were obtained from the China Meteorological Data Service Centre (http://data.cma.cn/).”
(4) The discussion attributes the non-significant annual NEP response to intra-annual precipitation variability, with grazing enhancing NEP under wet conditions but suppressing it under dry conditions. Another potential explanation may be that grazing affects GPP and ecosystem respiration (ER) at similar magnitudes (i.e., RR(GPP) ≈ RR(ER)), resulting in limited net changes in NEP.
Thank you for the comments. Another potential explanation has been revised in the manuscript as follows:
Lines 385-389, page 13: “Grazing decreased the responses of ecosystem CO2 fluxes and plant biomass in global grasslands, but only NEP was not significantly affected by grazing in our field experiment (Fig. 4). The lack of a significant response in NEP may be because the site in this field study was managed for year-round continuous low-intensity grazing (Liang et al., 2021). In addition, grazing affected GPP and ER at similar magnitudes, resulting in limited net changes in NEP.”
Recommendations for the authors:
Reviewing Editor Comments:
As you can see from the above reviews and the specific recommendations below, the first issue you should resolve is a full description of methodological detail such that readers can, in principle, repeat your study. They have to know how you placed the chamber to have a representative measure of vegetation (averaging between high and low biomass patches). They also must know how to calculate grazing intensity and assign the values to the three classes. They want to see your raw data and statistical analyses (including formulae, replication, and degrees of freedom). Consider non-linear relationships of grazing and wetness. Try to better integrate the results from the experiment and the meta-analysis. Finally, make sure that you develop hypotheses from the prior knowledge presented in the introduction. For instance, instead of stating that NEP responses would shift from negative to positive with increasing wetness index, simply hypothesize that wetness mitigates the negative effects of grazing on CO2 fluxes, even if you find that this is not true under heavy grazing.
Thank you for the comments. The description of methodological details has been supplemented in the revised manuscript. The results from the experiment and the meta-analysis have been integrated.
Reviewer #1 (Recommendations for the authors):
General suggestions:
(1) The Introduction section and the assumptions should be rewritten and improved. The logicality of the introduction should be revised to better prioritize and contextualize the research problem. The reader is lost since the links between assumptions and previous knowledge are not clear.
Thanks for the suggestion. The Introduction section and the assumptions have been rewritten as follows:
Lines 135-147, page 5: “Previous studies on the effects of grazing intensities on ecosystem CO2 fluxes have been constrained by limited spatial and temporal scales, which has led to an incomplete understanding of how different grazing intensities influence ecosystem CO2 fluxes. Furthermore, does the wetness modulate the effect of grazing on ecosystem CO2 fluxes in the typical steppe? Are these relationships globally generalizable? In this study, we investigated the effects of grazing intensities on ecosystem CO2 fluxes by combining a long-term (7-11 years) field experiment conducted in a typical steppe and a meta-analysis of global grasslands. The objectives of this study were to: (i) investigate the effects of grazing intensity with annual wetness fluctuations on ecosystem CO2 fluxes (GPP, ER and NEP) covering the 7th to 11th years of a continuous grazing experiment in a typical steppe as well as the meta-analysis in global grasslands; (ii) explore how environmental factors (particularly wetness index, soil moisture and temperature, and grazing intensity) regulate the effects of grazing on ecosystem CO2 fluxes.”
(2) In the "Materials and methods" section, you need to provide the reason why you chose the "wetness index" in this study, rather than other drought indices (such as Standardized Precipitation Evapotranspiration Index (SPEI), Aridity Index (AI)).
Thank you for the comments. Although the standardized precipitation evapotranspiration index (SPEI) would be a more appropriate indicator for this study, its calculation requires relatively long and continuous climate data series, which were difficult to obtain in our global meta-analysis. This limitation was particularly important because our study also included a meta-analysis, for which complete climatic datasets were often unavailable from the collected literature. In contrast, the Aridity Index (AI) cannot adequately reflect interannual variability. We have supplemented this limitation in the revised as follows:
Lines 482-483, page 15: “Furthermore, more drought or wetness indices should be investigated in future studies of grazing on ecosystem CO2 fluxes.”
(3) For the results and discussions, the results are currently presented in parallel (long-term experiment first, then meta-analysis). It is recommended to add a dedicated integration paragraph in the discussion.
Thank you for the comments. The dedicated integration paragraph has been supplemented in the revised manuscript as follows:
Lines 450-464, page 15: “Our long-term experiment and global meta-analysis jointly provided complementary evidence for understanding the effect of grazing on the ecosystem CO2 fluxes in grassland ecosystems. Long-term experiments revealed the mechanisms underlying the effects of grazing on plant characteristics and ecosystem CO2 fluxes under control conditions. And global meta-analysis further clarified the universality of these response patterns across different climatic zones and grassland types. It should be noticed that both field experiment and meta-analysis consistently revealed that wetness was an important factor in regulating the effect of ecosystem CO2 fluxes. Under wetter conditions, light grazing promoted compensatory plant growth, enhanced leaf turnover and photosynthetic recovery capabilities, thereby maintaining or even enhancing the NEP. Conversely, under drier conditions or heavy grazing pressure, a decrease in aboveground biomass and weakened ecosystem resilience jointly limited the ecosystem carbon uptake capacity. These results suggested that wetness determined whether grazing promoted or inhibited the carbon sink function in grasslands. Moderate grazing may be sustainable under better water conditions, while heavy grazing may exceed the ecosystem resilience threshold even under relatively wet conditions, leading to sustained ecological degradation.”
(4) Make sure that the whole manuscript has undergone professional proofreading, and check it carefully to avoid language mistakes.
Thank you for the comments. The manuscript has been revised by professional proofreading to avoid language mistakes.
Specific suggestions:
(1) Lines 126-131: It is recommended to explicitly state three levels of research questions: (i) How does grazing intensity affect ecosystem CO2 fluxes? (ii) Does the wetness index modulate this effect? (iii) Are these relationships globally generalizable? This will provide a clear logical thread for the paper.
Thanks for the suggestion. We have made following changes in the revised manuscript:
Lines 135-139, pages 5: “Previous studies on the effects of grazing intensities on ecosystem CO2 fluxes have been constrained by limited spatial and temporal scales, which has led to an incomplete understanding of how different grazing intensities influence ecosystem CO2 fluxes. Furthermore, does the wetness modulate the effect of grazing on ecosystem CO2 fluxes in the typical steppe? Are these relationships globally generalizable?”
(2) Lines 181: Briefly justify the choice of the De Martonne wetness index (Equation 1) in the introduction (why this index over other aridity indices).
Thank you for the comments. The De Martonne wetness index is easier to obtain compared to other drought index, as it only requires annual average temperature and precipitation data for calculation, facilitating the statistics of global meta-analysis. The justification of the De Martonne wetness index has been revised in the manuscript:
Lines 120-125, pages 4-5: “Annual precipitation is one of the climatic parameters, while the wetness index (WI) serves as a more integrative climatic indicator that incorporates both precipitation and temperature, thereby reflecting the overall water surplus or deficit (Song et al., 2019). A higher wetness index (WI > 30) indicates sufficient water availability for plant growth, whereas a lower wetness index (WI ≤ 30) suggests the water availability may be limited (De Martonne, 1926).”
(3) Lines 173-174: Please specify the exact timing of flux measurements (e.g., "measured three times per month between 9:00 and 11:00 AM" is already stated, but add "on sunny and calm days" to ensure consistent conditions).
Thanks for the suggestion. We have supplemented the exact timing of flux measurements in the revised manuscript as follows:
Lines 183-186, page 6: “The gas exchange measurements were conducted on sunny and calm days between 9:00 and 11:00, a time when the ecosystem CO2 fluxes represented the daily average (Niu et al., 2008; Rong et al., 2017; Yu et al., 2025), with a frequency of three times per month.”
(4) The RGR and AGB data provide important clues for explaining the moderating role of the wetness index, but the mechanistic chain can be further refined. It is recommended to use the structural equation model.
Thanks for the comments. The structural equation model has been supplemented to complete the mechanistic chain.
Lines 338-342, page 11: “Heavy grazing decreased C3 plant biomass but increased C4 plant richness compared with other treatments (Fig. S7). In addition, the structural equation model showed that grazing altered net ecosystem productivity by increasing soil temperature and relative growth rate, while decreasing aboveground biomass of plants (Fig. S8).”
Suggested addition: If data on soil moisture, soil nutrients (e.g., ammonium, nitrate), leaf photosynthetic parameters (e.g., maximum photosynthetic rate, stomatal conductance), or community composition are available, please incorporate them into the analysis to test a more complete mechanistic pathway.
Thanks for the comments. The data of the composition of C3 and C4 plant communities and their species richness have been supplemented to complete the mechanistic chain.
Lines 338-342, page 11: “Heavy grazing decreased C3 plant biomass but increased C4 plant richness compared with other treatments (Fig. S7). In addition, the structural equation model showed that grazing altered net ecosystem productivity by increasing soil temperature and relative growth rate, while decreasing aboveground biomass of plants (Fig. S8).”
(5) The current meta - analysis has established the moderating role of the wetness index, but there is room for further exploration: Test for non-linearity. Could the relationship between the wetness index and the grazing effect size (lnRR of NEP) be non-linear in the global data? Consider fitting models that include a quadratic term for the wetness index or using generalized additive models (GAMs). If a threshold is identified, report the threshold estimate and its confidence interval and discuss its management implications.
Thank you for the comments. Following the reviewer's suggestion, we further examined whether there is a nonlinear relationship between the wetness index (WI) and the magnitude of grazing effect (NEP_RR). We compared a linear mixed-effects model including a first-order term for WI with a quadratic mixed-effects model, and set Study ID as a random effect in both models. The results indicated that the AIC value of the quadratic model (256.56) was higher than that of the linear model (241.48), suggesting that adding the second-order term did not improve the model fitting precision. Based on this, we retained the simpler linear model in the revised manuscript.
Author response table 1.
The comparison of linear mixed-effects model and quadratic mixed-effects model
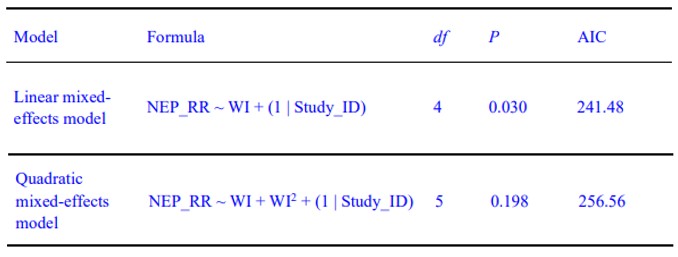
Note: if the AIC value was lower, the model fitting accuracy was higher.
(6) Section 4.1: This section is quite long. Consider splitting it into 2-3 paragraphs, discussing: (i) overall grazing effects on CO2 fluxes; (ii) the moderating role of the wetness index and its mechanisms; (iii) differential effects of grazing intensities.
Thanks for the suggestion. Section 4.1 has been split into four paragraphs according to the suggestion of the reviewer. (i) overall grazing effects on ecosystem CO 2 fluxes; (ii) the moderating role of the wetness index and its mechanisms; (iii) integrated discussion of field study and meta-analysis.
(7) Integrating the long-term experiment and meta-analysis. Does the effect size observed in the long - term experiment (e.g., an 85.83% increase in NEP under LG in the wettest year) align with the average effect size from the global meta - analysis under similar conditions? If not, what are the potential reasons? (e.g., specificity of the typical steppe, methodological differences between chamber and eddy covariance measurements) Is the mechanism identified in the long - term experiment (e.g., increased RGR) likely to be common globally? What are the joint management implications from both parts of the study? Are there contexts where caution is needed in extrapolating the findings? (e.g., alpine meadows might be more sensitive to grazing).
Thank you for the comments. The long-term experiment and meta-analysis have been integrated in the revised manuscript. The results of field experiment showed that light grazing increased NEP by 85.83%. However, the response of light grazing was not significant in meta-analysis. Both the results of field experiment and global meta-analysis showed that light grazing did not reduce NEP under wetter conditions. The different results in effect size and statistical significance were mainly because the long-term experiment was conducted in a typical grassland ecosystem, which may possess a strong compensatory growth capacity under moderate water conditions. Therefore, light grazing can enhance NEP by increasing plant photosynthetic rate, promoting new leaf growth, and improving community resource utilization efficiency. However, the global meta-analysis integrated different grassland types, climatic conditions and grazing durations. Consequently, the average effect of global meta-analysis may be diluted by the high heterogeneity among ecosystems. The data to calculate RGR were not available in the original studies of the meta-analysis, so we could not include RGR in the meta-analysis. Therefore, it is still unclear if the mechanism of increased RGR could be common globally. The joint management implications have been revised as follows:
Lines 393-400, page 13: “Both the results of field experiment and global meta-analysis showed that light grazing did not reduce NEP under wetter conditions (Fig. 3B, 6B and 7H). Light grazing usually stimulates leaf regrowth following defoliation, and these new leaves often are more physiologically active than the older leaves that contribute much of leaf area in ungrazed treatment (Polley et al., 2008), which likely imply a stronger leaf photosynthesis and C sink (Reich et al., 2007). Considering factors such as different grassland types (Fig. S11), livestock grazing modes (Fig. S12), climatic conditions, and grazing durations, the future grazing studies on NEP should focus more on ANPP and RGR, and extrapolate the results cautiously.”
(8) Figure 8: The conceptual diagram is clear and effectively summarizes the main findings. Briefly explain the meaning of the arrows in the caption.
Thank you for the suggestion. We have revised Fig. 8 accordingly:
“Schematic summary of the effects of grazing intensity on ecosystem carbon dioxide (CO2) fluxes and biomass in global grasslands in the meta-analysis. The blue and black arrows indicate negative effects on grazing and grazing intensities, respectively. Asterisks (*) indicate significant effects on variables at P < 0.05. GPP, gross primary productivity; ER, ecosystem respiration; NEP, net ecosystem productivity; LG, light grazing; MG, moderate grazing; HG, heavy grazing.
(9) Please check all references for consistency with eLife style. Some entries currently have inconsistent formatting (e.g., some include issue numbers, while others do not; page number formatting varies).
Thank you for the comments. We have checked the references one by one to revise them consistent with eLife style.
Reviewer #3 (Recommendations for the authors):
(1) Method citation:
(a) Please cite the original method references rather than studies that applied the methods. For example, the original publication introducing the wetness index (WI) is: De Martonne, E. Une nouvelle fonction climatologique: l'indice d'aridité. La Météorologie 2, 449-458 (1926).
(b) Please also cite the R packages used in the analysis. One straightforward approach is the function citation() in R.
Thank you for the comments. We have cited the references related to the original methods and cited the R packages used in the analysis.
(2) Several expressions would benefit from clarification:
(a) Line 182: What has been "referred to as soil moisture"?
Thank you for the comments. Soil moisture refers to the volumetric water content of the soil, which has been clarified in the revised manuscript as follows:
Lines 199-200, pages 7: “Soil moisture was the soil volumetric water content.”
(b) Line 184-185: Do you mean "soil temperature and soil moisture were measured simultaneously with ecosystem CO2 flux measurements."?
Thank you for the comments. Yes, we simultaneously measured soil temperature and soil moisture using temperature and moisture probes while measuring ecosystem CO 2 flux measurements. We have made following changes in the revised manuscript as follows:
Lines 198-199, page 7: “Soil temperature and moisture at a depth of 0-10 cm were measured simultaneously with ecosystem CO 2 flux measurements, using the probes of the LI-8100 system.”
(c) Line 200: Please clarify what is meant by "the caged plots"?
Thank you for the comments. The misleading words have been deleted in the revised manuscript.
(d) Line 242-244: Do you mean "data from non-grazed treatments were excluded when additional treatments were present"?
Thank you for the comments. Yes, data from non-grazed treatments were excluded when additional treatments were present. We have made following changes in the revised manuscript:
Lines 268-270, page 9: “(c) Data from non-grazed treatments were excluded when additional treatments (e.g., fertilization, experimental warming, or precipitation manipulation) were present.”
(e) Line 263: Should this refer to RR++ instead of RR? Please clarify how RR++ (or lnRR++) was calculated from the reported response ratios and study weights.
Thank you for the comments. RR is the dependent variable of the model, representing the response ratio for each observation. RR++ typically refers to the pooled effect size obtained after all RRs are weighted and subjected to a mixed-effects model, which primarily corresponds to the estimated value of the model intercept β0. We have made following changes in the revised manuscript:
Lines 293-303, page 10: “A linear mixed-effects model, with ‘study’ included as a random factor, was employed to estimate the weighted response ratio (RR++) across studies or within a specific group, fitting with restricted maximum likelihood using the ‘lmer’ function in the ‘lme4’ package (Feng et al., 2023).

where β0 is the coefficient, πstudy denotes the random effect associated with ‘study’ (accounting for autocorrelation among observations from the same study), and ɛ corresponds to the residual sampling error. We checked the normality of the model residuals using the ‘check_normality’ function in the ‘performance’ package. When the assumption of normality was violated, bootstrapping with 999 iterations was performed using the ‘boot’ package to derive the 95% confidence interval (CI) for each RR++ (Chen et al., 2021).”
(3) Line 222: Please list all environmental predictors considered in the analysis.
Thank you for the comments. The environmental predictors considered in the analysis have been listed in the revised manuscript:
Lines: 243-245, page 8: “The environmental predictors considered in the analysis included grazing intensity, the response ratio of soil temperature and soil moisture, wetness index, and grazing duration.”
(4) Line 343: The non-significant response of NEP appears only under MG, while both LG and HG significantly decrease NEP (Fig. 5). It may be helpful to discuss this grazing-intensity-dependent response more explicitly.
Thank you for the comments. The reason why the non-significant response of NEP appeared only under MG was that moderate grazing affected GPP and ER at similar magnitudes, resulting in limited changes in NEP (Fig. 5). However, the reduction in response of GPP was higher than that of ER in LG and HG, resulting in the decrease in NEP. This was consistent with the hypothesis of moderate disturbance, which suggested that ecosystem functions remain stable under moderate levels of disturbance. We have made following changes in the revised manuscript:
Lines 390-393, page 13: “Similarly, the reason why the non-significant response of NEP appeared only under MG may be that moderate grazing affected GPP and ER at similar magnitudes, resulting in limited changes in NEP (Fig. 5). However, the reduction in response of GPP was higher than that of ER in LG and HG, resulting in the decrease in NEP.”
(5) Line 397: The phrase "global-scale study" typically refers to experiments conducted worldwide. "Studies across global grasslands" may be more precise here.
Thank you for the comments. We have made following changes in the revised manuscript:
Lines: 475-477, page 15: “Our meta-analysis has limitations due to the relatively small sample size, which stems from the scarcity of studies across global grasslands exploring the effects of grazing intensity on ecosystem CO2 fluxes.”
(6) Line 403: ...have large amounts of grassland for grazing, "but rarely investigated".
Thank you for the comments. We have made following changes according to the suggestion of the reviewer in the revised manuscript as follows:
Lines 480-482, pages 15-16: “In addition, future studies could conduct more experiments of ecosystem CO2 fluxes in South America, Africa and Oceania, which have large amounts of grasslands for grazing, but were rarely investigated.”
(7) Please remember to cite Figure 8 in the text.
Thank you for the comments. Figure 8 has been cited in the manuscript as follows:
Lines 411-414, page 13: “Moderate grazing decreased GPP and NEP under lower WI, but the responses of GPP and NEP to moderate grazing were similar under higher WI in global grasslands (Figs. 6 and 8), indicating that higher wetness offset the response of GPP and NEP to moderate grazing.”
(8) Figure S1:
(a) The orange line in panel A appears to represent monthly temperature rather than mean annual temperature.
(b) Same for the precipitation, the data shown here should be monthly values rather than annual means.
(c) Consider using a color different from orange for the wetness index in panel C, unless the variable shown is temperature instead.
Thank you for the comments. We have revised Fig. S1 according to the suggestion of the reviewer as follows:
Supplementary page 5: “Fig. S1 The monthly total precipitation and average air temperature (A), annual precipitation (B) and wetness index (C) in the study area of the grazing intensity experiment in the typical steppe from 2019 to 2023.”
(9) Figure S2B: Grazing intensity labels appear in Chinese in the figure. These should be translated into English, and the information on grazing intensity should be provided in the legend or the figure here, as well as in the Method section.
Thank you for the comments. We have replaced the figures included the Chinese labels. See Fig. S2.
(10) Figure S6B: LG significantly affects the relationships between wetness index and ER (P<0.05), but a regression line is missing from the panel.
Thank you for the comments. We have added the regression line between wetness index and ER in Supplementary Fig. S6.
(11) Figure S7A: "Mean" annual precipitation
Thank you for the comments. The “Mean” has been revised in Figure S10A.
References
Fan, Y., Zhang, X., Wang, J., & Shi, P. (2011). Effect of solar radiation on net ecosystem CO2 exchange of alpine meadow on the Tibetan Plateau.Journal of Geographical Sciences, 21(4), 666-676.
Jiang, Z., Hu, Z., Lai, D., Han, D., Wang, M., Liu, M., Zhang, M., & Guo, M. (2020). Light grazing facilitates carbon accumulation in subsoil in Chinese grasslands: A meta-analysis. Global Change Biology, 26(12), 7186–7197.
Li, X., Fu, H., Guo, D., Li, X., & Wan, C. (2010). Partitioning soil respiration and assessing the carbon balance in a Setaria italica (L.) Beauv. Cropland on the Loess Plateau, Northern China. Soil Biology and Biochemistry, 42(2), 337-346.
Niu, S., Wu, M., Han, Y., Xia, J., Li, L., & Wan, S. (2008). Water‐mediated responses of ecosystem carbon fluxes to climatic change in a temperate steppe. New Phytologist, 177(1), 209-219.
Rong, Y., Johnson, D. A., Wang, Z., & Zhu, L. (2017). Grazing effects on ecosystem CO2 fluxes regulated by interannual climate fluctuation in a temperate grassland steppe in northern China. Agriculture, Ecosystems & Environment, 237, 194-202.
Shi, R., Su, P., Zhou, Z., Yang, J., & Ding, X. (2022). Comparison of eddy covariance and automatic chamber‐based methods for measuring carbon flux. Agronomy Journal, 114.
Wan, L., Liu, G., & Su, X. (2025). Global meta-analysis reveals different grazing management strategies change greenhouse gas emissions and global warming potential in grasslands. Geography and Sustainability, 6(3), 100251.
Yin, M., Gao, X., Kuang, W., & Tenuta, M. (2023). Soil N2O emissions and functional genes in response to grazing grassland with livestock: A meta-analysis. Geoderma, 436, 116538.
Yu, H., Wang, X., Wu, Y., Wang, C., Yan, R., Xu, D., & Xin, X. (2025). Light grazing tends to enhance ecosystem carbon sequestration and resource use efficiency in a meadow steppe of northern China. Agricultural and Forest Meteorology, 372, 110690.
Zhang, R., Tian, D., Chen, H. Y. H., Seabloom, E. W., Han, G., Wang, S., Yu, G., Li, Z., & Niu, S. (2022). Biodiversity alleviates the decrease of grassland multifunctionality under grazing disturbance: A global meta-analysis. Global Ecology and Biogeography, 31(1), 155–167.
Zhou, G., Luo, Q., Chen, Y., Hu, J., He, M., Gao, J., Zhou, L., Liu, H., & Zhou, X. (2019). Interactive effects of grazing and global change factors on soil and ecosystem respiration in grassland ecosystems: A global synthesis. Journal of Applied Ecology, 56(8), 2007–2019.



