
Comparison of freshly cultured versus cryopreserved mesenchymal stem cells in animal models of inflammation: A pre-clinical systematic review

- Division of Critical Care Medicine, Department of Medicine, Western University, Canada
- Regenerative Medicine Program, Ottawa Hospital Research Institute, Canada
- Knowledge Synthesis Group, Ottawa Hospital Research Institute, Canada
- University of Ottawa, Canada
- Clinical Epidemiology, Ottawa Hospital Research Institute, Canada
- Division of Critical Care, Department of Medicine, University of Ottawa, Canada
Figures
Figure 1
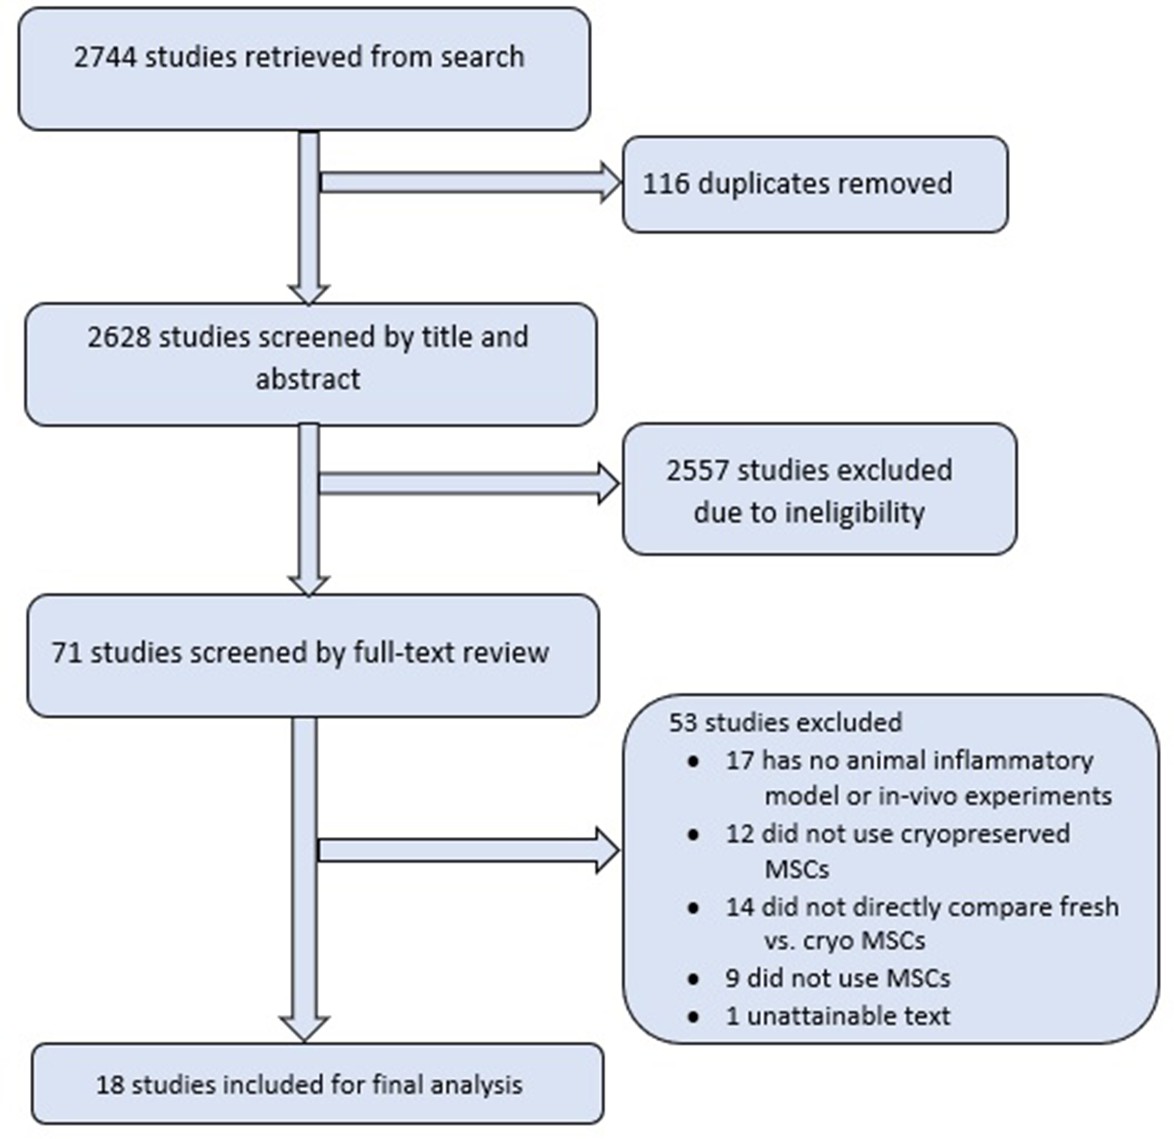
Literature search and study inclusion.
Figure 2
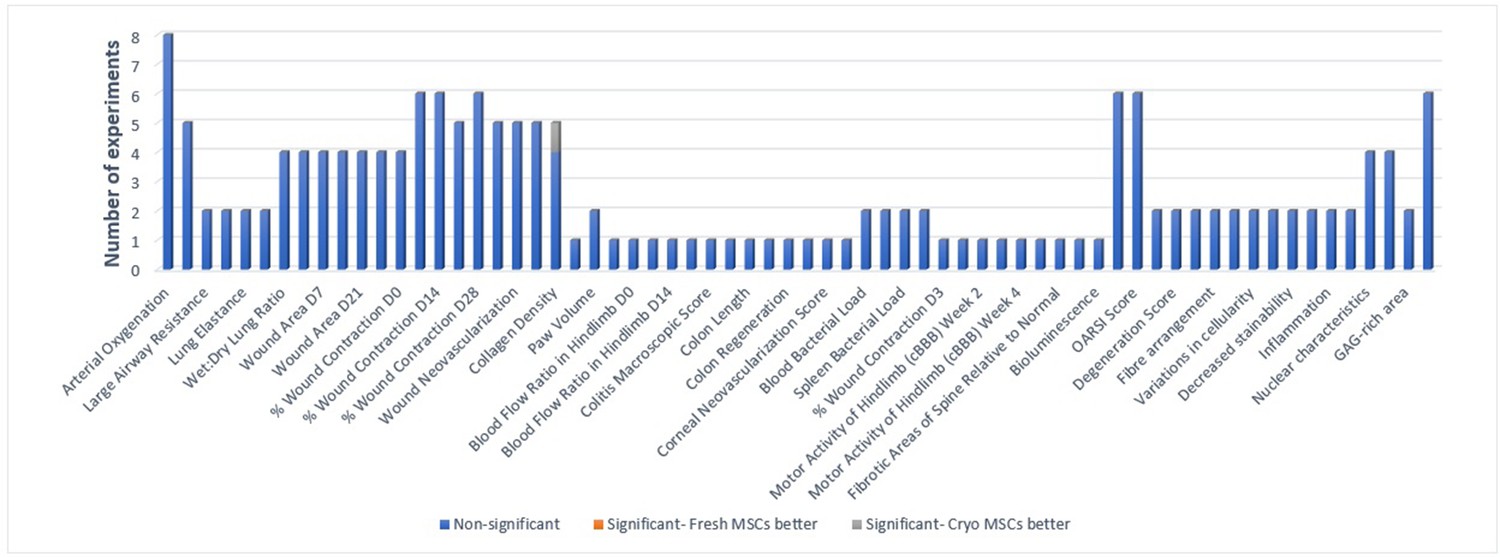
Primary in vivo outcomes.
All the outcomes related to function and composition of tissues are presented below. Number of experiments represent the number of separate comparisons between freshly cultured and cryopreserved MSCs on surrogate measures of in vivo efficacy.
Figure 3

Primary in-vivo outcomes.
All the outcomes related to protein (cytokine) expression and secretion are presented below. Number of experiments represent the number of separate comparisons between freshly cultured and cryopreserved MSCs on surrogate measures of in vivo efficacy.
Figure 4
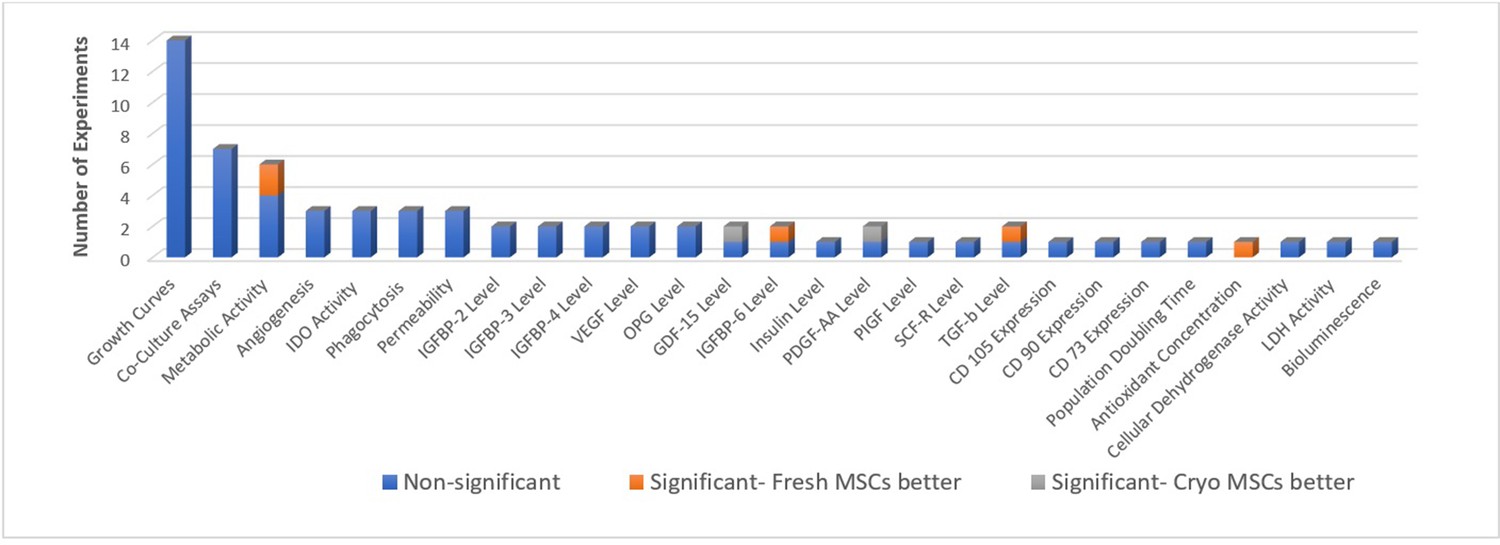
In-vitro potency outcomes.
All the in-vitro reported outcomes are displayed below. Number of experiments represent the number of separate comparisons between freshly-cultured and cryopreserved MSCs on surrogate measures of in vivo efficacy.
Figure 5
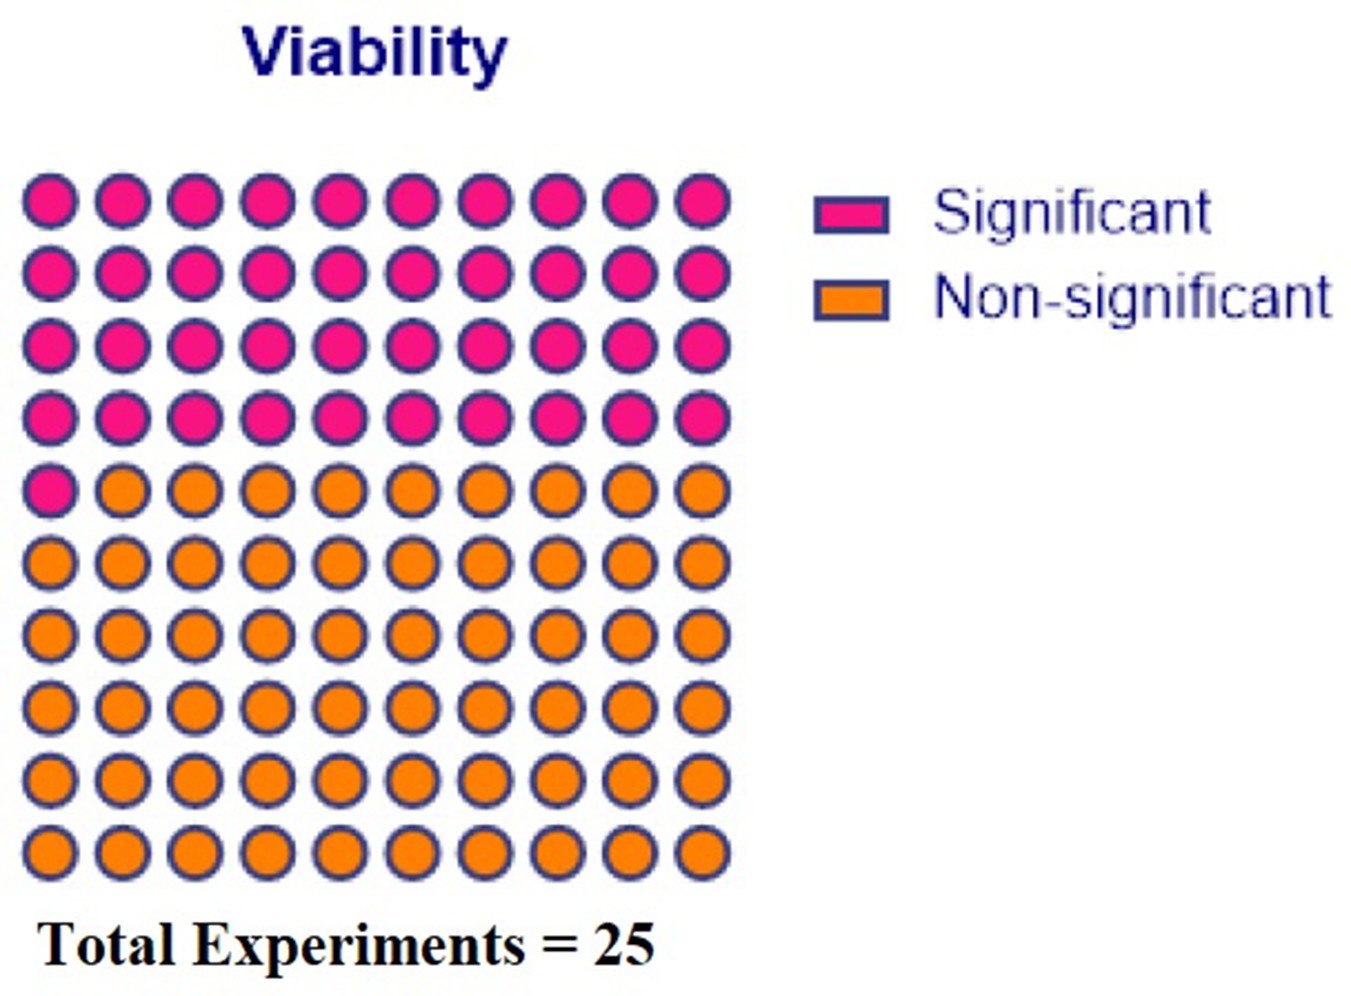
Comparison of viability.
Experiments where viability at varying time points of freshly-cultured and cryopreserved MSCs were compared directly are presented below.
Tables
Table 1
Models of inflammation and characteristics of included studies.
| First Author (Year) | Animal Inflammatory Model | Country | Language of Publication | Species | Strain | Gender | Sample size | Age (range) | Weight (grams) |
|---|---|---|---|---|---|---|---|---|---|
| Bárcia et al., 2017 | 1) Chronic adjuvant-induced arthritis (AIA) model 2) Hindlimb ischemia model | Portugal | English | 1) Rat 2) Mouse | 1) Winstar 2) C57BL/6 | 1) Male 2) Female | 1) 18 2) 36 | 1) NR 2) 12 weeks | 1) 365–480 g 2) NR |
| Cruz et al., 2015 | Allergic Airways Inflammation induced by Aspergillus hyphal extract (AHE) exposure in immunocompetent mice | USA | English | Mouse | C57BL/6 | Male | 72 | 8–12 weeks | NR |
| Curley et al., 2017 | Acute respiratory distress syndrome by intratracheal instillation of E. coli | Canada | English | Rat | Sprague-Dawley (specific pathogen-free) | Male | NR | NR | 350–450 g |
| Devaney et al., 2015 | Acute lung injury induced by E. coli pneumonia | Ireland | English | Rat | Sprague-Dawley (specific pathogen-free) | Male | 40 | NR | 350–450 g |
| Gramlich et al., 2016 | Retinal Ischemia/Reperfusion Injury Model | USA | English | Mouse | C57BL6/J | Male and Female | 37 | 2 months | NR |
| Lohan et al., 2018 | Corneal Transplantation | Ireland | English | Rat | Lewis | Male | NR | 8–14 weeks | NR |
| Salmenkari et al., 2019 | Colitis (3% DSS) | Finland | English | Mouse | Balb/c | Male | NR | 8 weeks | NR |
| Somal et al., 2017 | Wound healing | India | English | Rat | Wistar | Male | 27 | NR | NR |
| Bharti et al., 2020 | Wound healing | India | English | Guinea pigs | Dunkin Hartley | Male | 25 | NR | NR |
| Horie et al., 2020a | Ventilator-induced Lung Injury | Ireland | English | Rats | NR | NR | NR | NR | NR |
| Horie et al., 2020a | E. coli-induced lung injury | Ireland | English | Rats | Pathogen-free sprague Dawley | Male | NR | NR | 300–450 g |
| Khan et al., 2019 | Spinal Cord Injury induced through a balloon compression method | Korea | English | Dog | Beagle | NR | 12 | 1.2+/-0.2 years | 12+/-3 kg |
| Rogulska et al., 2019 | Wound healing | Ukraine | English | Mouse | Balb/C | Male | 27 | 5–6 months | 25–30 g |
| Tan et al., 2019 | Polymicrobial sepsis induced by cecal-ligation-and-puncture (CLP) | Canada | English | Mouse | C57BL6/J | Female | NR | 8 weeks | 17–21 g |
| Perlee et al., 2019 | K.K. pneumoniae induced pneumosepsis | Netherlands | English | Mouse | Pathogen free C57BL/6 | Female | NR | 8–10 weeks | NR |
| Yea et al., 2020 | Wound healing | Korea | English | Rat | Sprague-Dawley | Male | 120 | 12 weeks | 340–360 g |
| Horiuchi et al., 2021 | Osteoarthritis | Japan | English | Rat | Wildtype Lewis | Female | 40 | 10 weeks | 180–200 g |
| Horie et al., 2021 | Ventilator-Induced Lung Injury | Ireland | English | Rat | Sprague-Dawley | Male | 28 | NR | 350–450 g |
-
NR = Not Reported.
Table 2
MSC characteristics of included studies.
| First author (Year) | Species and tissue source | Compatibility with animal | ISCT criteria met | Route of administration | Vehicle | Timing of MSCs post-disease induction | Fresh MSCs | Cryopreserved MSCs | |||
|---|---|---|---|---|---|---|---|---|---|---|---|
| Cryopreserved at any point? | Duration of culture | Method | Duration | Time from Thaw to Experiment | |||||||
| Bárcia et al., 2017 | Human Umbilical Cord | Xenogenic | Yes | 1) Intra-articular 2) Intra-muscular | PBS | 1) 7 days 2) 5 hr | No | >5 days | Controlled Rate Freezer | NR | Immediately |
| Cruz et al., 2015 | Human and Murine Bone Marrow | Syngenic and Xenogenic | Yes | Intravenous | PBS | 14 days | Yes | NR | -–80°C for 48 hr then liquid nitrogen | 9 days | 15 min |
| Curley et al., 2017 | Human Umbilical Cord and Bone Marrow | Xenogenic | Yes | Intravenous | PBS | NR | No | 4 days | Controlled Rate Freezer | NR | Day of administration |
| Devaney et al., 2015 | Human Bone Marrow | Xenogenic | Yes | Intravenous | PBS | 0.5 hr | Yes | NR | NR | NR | 30 min |
| Gramlich et al., 2016 | Human | Xenogenic | Yes | Intra-ocular | PBS | 2 hr | Yes | >7 days | Controlled Rate Freezer | 7–30 days | <1 hr |
| Lohan et al., 2018 | Rat Bone Marrow | Allogenic | NR | Intravenous | PBS | 1 and 7 days prior | Yes | NR | –80°C for 24 hr then liquid nitrogen | NR | Immediately |
| Salmenkari et al., 2019 | Human Bone Marrow | Xenogenic | NR | Intravenous | 0.9% NaCl +3.6% HAS | 3 and 5 days | Yes | NR | NR | NR | NR |
| Somal et al., 2017 | Gravid caprine AF (amniotic fluid), AS (amniotic sac), WJ (Wharton's jelly), CB (cord blood) | Xenogenic | NR | Subcutaneously | PBS | 7, 14, 21, 28 days | Yes | NR | –80°C overnight then liquid nitrogen | Atleast 1 month | NR |
| Bharti et al., 2020 | Dog Bone Marrow | Xenogenic | NR | Surgically placed over wound | Polypropylene mesh | NR | Yes | NR | –80°C overnight then liquid nitrogen | 1 month | NR |
| Horie et al., 2020a | Human Bone Marrow | Xenogenic | NR | Intravenous | PBS | 6 hr | Yes | NR | NR | NR | NR |
| Horie et al., 2020a | Human Bone Marrow and Umbilical Cord | Xenogenic | NR | Intra-tracheal | PBS | 30 min | Yes | NR | NR | NR | Immediately |
| Khan et al., 2019 | Dog Adipose Tissue | Allogenic | NR | Intravenous | Hartmann’s Solution | Immediately | Yes | NR | 4 °C for 1 hr, –20 °C for 2 hr, –80 °C for 24 hr, then –150 °C | 2–3 weeks | Immediately |
| Rogulska et al., 2019 | Human Adipose Tissue | Xenogenic | NR | Implantation into wound | 3D gel | Immediately | Yes | NR | –80°C the liquid nitrogen | 1 month | NR |
| Tan et al., 2019 | Human Bone Marrow | Xenogenic | Yes | Intravenous | 5% Human Albumin in PlasmaLyte | 6 hr | No | >24 hr | Controlled Rate Freezer | NR | Immediately |
| Perlee et al., 2019 | Human Adipose Tissue | Xenogenic | Yes | Intravenous | Ringer’s Lactate | 1 or 6 hr | No | 24 hr | Liquid nitrogen | Until required | Day of administration |
| Yea et al., 2020 | Human Umbilical Cord | Xenogenic | NR | Intratendinous | PBS | Immediately | No | NR | –80°C then –196 °C Liquid Nitrogen | Up to 1 month | Immediately |
| Horiuchi et al., 2021 | Rat Synovial Fluid | Allogenic | NR | Intraarticular | PBS | Every week from 2 to 8 weeks | Yes | 7 days | –80 °C overnight, and then at –150 °C | 16 months | Immediately |
| Horie et al., 2021 | Human Umbilical Cord | Xenogenic | NR | Intravenous | PBS | 15 min | No | NR | NR | Up to 2 months | Immediately |
Table 3
Risk of Bias assessments for the included in vivo studies using SYRCLE Tool.
| Selection Bias | Performance Bias | Detection Bias | Attrition Bias | Reporting Bias | Other Bias | |||||
| Author (year) | Adequate randomization | Baseline charactersics given | Evidence of adequate concealment of groups | Evidence of random housing of animals | Evidence of caregivers blinded to intervention | Evidence of random selection for assessment | Evidence of assessor blinded | Explanation of missing animal data | Free of selective reporting based on methods/results | Free of other high bias risk |
| Bárcia et al., 2017 | Unclear | Yes (Low Risk) | Unclear | Yes (Low Risk) | No (High Risk) | Unclear | No (High Risk) | Yes (Low Risk) | Yes (Low Risk) | No (High Risk) |
| Bharti et al., 2020 | Unclear | Unclear | Unclear | Yes (Low Risk) | Unclear | Unclear | Unclear | Unclear | Yes (Low Risk) | Yes (Low Risk) |
| Cruz et al., 2015 | Unclear | Yes (Low Risk) | Unclear | Yes (Low Risk) | Unclear | Unclear | Yes (Low Risk) | Unclear | Yes (Low Risk) | Yes (Low Risk) |
| Curley et al., 2017 | Unclear | Yes (Low Risk) | Unclear | Unclear | Unclear | Unclear | Yes (Low Risk) | Unclear | Yes (Low Risk) | Yes (Low Risk) |
| Devaney et al., 2015 | Unclear | Yes (Low Risk) | Unclear | Unclear | Unclear | Unclear | No (High Risk) | Yes (Low Risk) | Yes (Low Risk) | Yes (Low Risk) |
| Gramlich et al., 2016 | No (High Risk) | Yes (Low Risk) | Unclear | Unclear | Unclear | Unclear | Yes (Low Risk) | Unclear | Yes (Low Risk) | No (High Risk) |
| Horie et al., 2020a | Unclear | Unclear | Unclear | Unclear | Unclear | Unclear | Yes (Low Risk) | Unclear | Yes (Low Risk) | Yes (Low Risk) |
| Horie et al., 2020a | Unclear | Unclear | Unclear | Unclear | Unclear | Unclear | Unclear | Yes (Low Risk) | Yes (Low Risk) | Yes (Low Risk) |
| Khan et al., 2019 | Unclear | Yes (Low Risk) | Unclear | Unclear | Yes (Low Risk) | Unclear | Yes (Low Risk) | Yes (Low Risk) | Yes (Low Risk) | Yes (Low Risk) |
| Lohan et al., 2018 | No (High Risk) | Unclear | Unclear | Unclear | Unclear | Unclear | Unclear | Unclear | No (High Risk) | Yes (Low Risk) |
| Perlee et al., 2019 | No (High Risk) | Unclear | Unclear | Yes (Low Risk) | Unclear | Unclear | Yes (Low Risk) | Unclear | Yes (Low Risk) | Yes (Low Risk) |
| Rogulska et al., 2019 | Unclear | Yes (Low Risk) | Unclear | Yes (Low Risk) | Unclear | Unclear | Yes (Low Risk) | Unclear | Yes (Low Risk) | No (High Risk) |
| Salmenkari et al., 2019 | No (High Risk) | Yes (Low Risk) | Unclear | Yes (Low Risk) | Unclear | Unclear | Yes (Low Risk) | Yes (Low Risk) | Yes (Low Risk) | Yes (Low Risk) |
| Somal et al., 2017 | No (High Risk) | Unclear | Unclear | Yes (Low Risk) | Unclear | Unclear | Unclear | Unclear | Yes (Low Risk) | Yes (Low Risk) |
| Tan et al., 2019 | Yes (Low Risk) | Yes (Low Risk) | Yes (Low Risk) | Unclear | Yes (Low Risk) | Unclear | Yes (Low Risk) | Yes (Low Risk) | Yes (Low Risk) | Yes (Low Risk) |
| Yea et al., 2020 | Unclear | Yes (Low Risk) | Unclear | Yes (Low Risk) | Unclear | Unclear | Unclear | Unclear | Yes (Low Risk) | Yes (Low Risk) |
| Horiuchi et al., 2021 | Unclear | Yes (Low Risk) | Unclear | Yes (Low Risk) | Unclear | Unclear | Unclear | Unclear | Yes (Low Risk) | Yes (Low Risk) |
| Horie et al., 2021 | Unclear | Yes (Low Risk) | Yes (Low Risk) | Yes (Low Risk) | Unclear | Unclear | Yes (Low Risk) | Unclear | Yes (Low Risk) | Yes (Low Risk) |
Table 4
All in vivo outcomes where freshly cultured vs. cryopreserved MSCs have been compared directly are reported.
| Study | Animal Model | Outcome | Number (n) | Type and Source of MSCs | Duration of Culture Post-Thaw (hr) | Concentration of MSCs | Pre-Treatment of MSCs | Negative Control (NC) | Positive Control (PC) | p-value for Fresh MSCs vs. control | p-value for Frozen MSCs vs. control | Fresh or Frozen MSC more effective? | p-value for Fresh vs. Frozen comparison |
|---|---|---|---|---|---|---|---|---|---|---|---|---|---|
| Acute Lung Injury and Sepsis | |||||||||||||
| Devaney et al., 2015 | Acute lung injury induced by E. coli pneumonia in rats | Arterial oxygenation | 10 | Human Bone Marrow | 0 | 1×10^7 hMSCs/kg | N/A | N/A | PBS | <0.05 | <0.05 | ↔ | NS |
| Lung compliance | 10 | Human Bone Marrow | 0 | 1×10^7 hMSCs/kg | N/A | N/A | PBS | <0.05 | <0.05 | ↔ | NS | ||
| BAL protein | 10 | Human Bone Marrow | 0 | 1×10^7 hMSCs/kg | N/A | N/A | PBS | <0.05 | <0.05 | ↔ | NS | ||
| BAL neutrophils | 10 | Human Bone Marrow | 0 | 1×10^7 hMSCs/kg | N/A | N/A | PBS | <0.05 | <0.05 | ↔ | NS | ||
| BAL E. coli bacterial load | 10 | Human Bone Marrow | 0 | 1×10^7 hMSCs/kg | N/A | N/A | PBS | <0.05 | <0.05 | ↔ | NS | ||
| BAL IL-6 | 10 | Human Bone Marrow | 0 | 1×10^7 hMSCs/kg | N/A | N/A | PBS | <0.05 | <0.05 | ↔ | NS | ||
| BAL IL-10 | 10 | Human Bone Marrow | 0 | 1×10^7 hMSCs/kg | N/A | N/A | PBS | <0.05 | <0.05 | ↔ | NS | ||
| Cruz et al., 2015 | Allergic Airways Inflammation induced by Aspergillus hyphal extract (AHE) exposure in mice. | Large Airway Resistance | 10 (Fresh) and 7 (Frozen) | Human Bone Marrow | 0 | 1 × 10^6 viable MSC cells | Frozen MSCs washed 3 times prior to use | Naïve (PBS model) | AHE +PBS, Human Lung Fibroblasts | <0.05 | <0.05 | ↔ | NS |
| Large Airway Resistance | 6 | Murine Bone Marrow | 0 | 1 × 10^6 viable MSC cells | Frozen MSCs washed 3 times prior to use | Naïve (PBS model) | AHE +PBS, Human Lung Fibroblasts | <0.05 | <0.05 | ↔ | NS | ||
| Overall Tissue Resistance | 10 (Fresh) and 7 (Frozen) | Human Bone Marrow | 0 | 1 × 10^6 viable MSC cells | Frozen MSCs washed 3 times prior to use | Naïve (PBS model) | AHE +PBS, Human Lung Fibroblasts | <0.05 | <0.05 | ↔ | NS | ||
| Overall Tissue Resistance | 6 | Murine Bone Marrow | 0 | 1 × 10^6 viable MSC cells | Frozen MSCs washed 3 times prior to use | Naïve (PBS model) | AHE +PBS, Human Lung Fibroblasts | <0.05 | <0.05 | ↔ | NS | ||
| Lung Elastance | 10 (Fresh) and 7 (Frozen) | Human Bone Marrow | 0 | 1 × 10^6 viable MSC cells | Frozen MSCs washed 3 times prior to use | Naïve (PBS model) | AHE +PBS, Human Lung Fibroblasts | <0.05 | <0.05 | ↔ | NS | ||
| Lung Elastance | 6 | Murine Bone Marrow | 0 | 1 × 10^6 viable MSC cells | Frozen MSCs washed 3 times prior to use | Naïve (PBS model) | AHE +PBS, Human Lung Fibroblasts | <0.05 | <0.05 | ↔ | NS | ||
| Inflammation Score | 10 (Fresh) and 7 (Frozen) | Human Bone Marrow | 0 | 1 × 10^6 viable MSC cells | Frozen MSCs washed 3 times prior to use | Naïve (PBS model) | AHE +PBS, Human Lung Fibroblasts | <0.05 | <0.05 | ↔ | NS | ||
| Inflammation Score | 6 | Murine Bone Marrow | 0 | 1 × 10^6 viable MSC cells | Frozen MSCs washed 3 times prior to use | Naïve (PBS model) | AHE +PBS, Human Lung Fibroblasts | <0.05 | <0.05 | ↔ | NS | ||
| BALF Total Cell Number | 10 (Fresh) and 7 (Frozen) | Human Bone Marrow | 0 | 1 × 10^6 viable MSC cells | Frozen MSCs washed 3 times prior to use | Naïve (PBS model) | AHE +PBS, Human Lung Fibroblasts | <0.05 | <0.05 | ↔ | NS | ||
| BALF Total Cell Number | 6 | Murine Bone Marrow | 0 | 1 × 10^6 viable MSC cells | Frozen MSCs washed 3 times prior to use | Naïve (PBS model) | AHE +PBS, Human Lung Fibroblasts | <0.05 | <0.05 | ↔ | NS | ||
| BAL Neutrophils | 10 (Fresh) and 7 (Frozen) | Human Bone Marrow | 0 | 1 × 10^6 viable MSC cells | Frozen MSCs washed 3 times prior to use | Naïve (PBS model) | AHE +PBS, Human Lung Fibroblasts | <0.05 | <0.05 | ↔ | NS | ||
| BAL Neutrophils | 6 | Murine Bone Marrow | 0 | 1 × 10^6 viable MSC cells | Frozen MSCs washed 3 times prior to use | Naïve (PBS model) | AHE +PBS, Human Lung Fibroblasts | <0.05 | <0.05 | ↔ | NS | ||
| BAL Eosinophils | 10 (Fresh) and 7 (Frozen) | Human Bone Marrow | 0 | 1 × 10^6 viable MSC cells | Frozen MSCs washed 3 times prior to use | Naïve (PBS model) | AHE +PBS, Human Lung Fibroblasts | <0.05 | <0.05 | ↔ | NS | ||
| BAL Eosinophils | 6 | Murine Bone Marrow | 0 | 1 × 10^6 viable MSC cells | Frozen MSCs washed 3 times prior to use | Naïve (PBS model) | AHE +PBS, Human Lung Fibroblasts | <0.05 | <0.05 | ↔ | NS | ||
| BAL Macrophages | 10 (Fresh) and 7 (Frozen) | Human Bone Marrow | 0 | 1 × 10^6 viable MSC cells | Frozen MSCs washed 3 times prior to use | Naïve (PBS model) | AHE +PBS, Human Lung Fibroblasts | <0.05 | <0.05 | ↔ | NS | ||
| BAL Macrophages | 6 | Murine Bone Marrow | 0 | 1 × 10^6 viable MSC cells | Frozen MSCs washed 3 times prior to use | Naïve (PBS model) | AHE +PBS, Human Lung Fibroblasts | <0.05 | <0.05 | ↔ | NS | ||
| BAL Lymphocytes | 10 (Fresh) and 7 (Frozen) | Human Bone Marrow | 0 | 1 × 10^6 viable MSC cells | Frozen MSCs washed 3 times prior to use | Naïve (PBS model) | AHE +PBS, Human Lung Fibroblasts | <0.05 | <0.05 | ↔ | NS | ||
| BAL Lymphocytes | 6 | Murine Bone Marrow | 0 | 1 × 10^6 viable MSC cells | Frozen MSCs washed 3 times prior to use | Naïve (PBS model) | AHE +PBS, Human Lung Fibroblasts | <0.05 | <0.05 | Frozen better | <0.05 | ||
| BAL IL-1a | 10 (Fresh) and 7 (Frozen) | Human Bone Marrow | 0 | 1 × 10^6 viable MSC cells | Frozen MSCs washed 3 times prior to use | Naïve (PBS model) | AHE +PBS, Human Lung Fibroblasts | <0.05 | <0.05 | ↔ | NS | ||
| BAL IL-1a | 6 | Murine Bone Marrow | 0 | 1 × 10^6 viable MSC cells | Frozen MSCs washed 3 times prior to use | Naïve (PBS model) | AHE +PBS, Human Lung Fibroblasts | <0.05 | <0.05 | ↔ | NS | ||
| BAL IL-3 | 10 (Fresh) and 7 (Frozen) | Human Bone Marrow | 0 | 1 × 10^6 viable MSC cells | Frozen MSCs washed 3 times prior to use | Naïve (PBS model) | AHE +PBS, Human Lung Fibroblasts | <0.05 | <0.05 | ↔ | NS | ||
| BAL IL-3 | 6 | Murine Bone Marrow | 0 | 1 × 10^6 viable MSC cells | Frozen MSCs washed 3 times prior to use | Naïve (PBS model) | AHE +PBS, Human Lung Fibroblasts | <0.05 | <0.05 | ↔ | NS | ||
| BAL IL-4 | 10 (Fresh) and 7 (Frozen) | Human Bone Marrow | 0 | 1 × 10^6 viable MSC cells | Frozen MSCs washed 3 times prior to use | Naïve (PBS model) | AHE +PBS, Human Lung Fibroblasts | <0.05 | <0.05 | ↔ | NS | ||
| BAL IL-4 | 6 | Murine Bone Marrow | 0 | 1 × 10^6 viable MSC cells | Frozen MSCs washed 3 times prior to use | Naïve (PBS model) | AHE +PBS, Human Lung Fibroblasts | <0.05 | <0.05 | ↔ | NS | ||
| BAL IL-5 | 10 (Fresh) and 7 (Frozen) | Human Bone Marrow | 0 | 1 × 10^6 viable MSC cells | Frozen MSCs washed 3 times prior to use | Naïve (PBS model) | AHE +PBS, Human Lung Fibroblasts | <0.05 | <0.05 | ↔ | NS | ||
| BAL IL-5 | 6 | Murine Bone Marrow | 0 | 1 × 10^6 viable MSC cells | Frozen MSCs washed 3 times prior to use | Naïve (PBS model) | AHE +PBS, Human Lung Fibroblasts | <0.05 | <0.05 | ↔ | NS | ||
| BAL IL-6 | 10 (Fresh) and 7 (Frozen) | Human Bone Marrow | 0 | 1 × 10^6 viable MSC cells | Frozen MSCs washed 3 times prior to use | Naïve (PBS model) | AHE +PBS, Human Lung Fibroblasts | <0.05 | <0.05 | ↔ | NS | ||
| BAL IL-6 | 6 | Murine Bone Marrow | 0 | 1 × 10^6 viable MSC cells | Frozen MSCs washed 3 times prior to use | Naïve (PBS model) | AHE +PBS, Human Lung Fibroblasts | <0.05 | <0.05 | ↔ | NS | ||
| BAL IL-10 | 10 (Fresh) and 7 (Frozen) | Human Bone Marrow | 0 | 1 × 10^6 viable MSC cells | Frozen MSCs washed 3 times prior to use | Naïve (PBS model) | AHE +PBS, Human Lung Fibroblasts | <0.05 | <0.05 | ↔ | NS | ||
| BAL IL-10 | 6 | Murine Bone Marrow | 0 | 1 × 10^6 viable MSC cells | Frozen MSCs washed 3 times prior to use | Naïve (PBS model) | AHE +PBS, Human Lung Fibroblasts | <0.05 | <0.05 | ↔ | NS | ||
| BAL IL-12-p40 | 10 (Fresh) and 7 (Frozen) | Human Bone Marrow | 0 | 1 × 10^6 viable MSC cells | Frozen MSCs washed 3 times prior to use | Naïve (PBS model) | AHE +PBS, Human Lung Fibroblasts | <0.05 | <0.05 | ↔ | NS | ||
| BAL IL-12-p40 | 6 | Murine Bone Marrow | 0 | 1 × 10^6 viable MSC cells | Frozen MSCs washed 3 times prior to use | Naïve (PBS model) | AHE +PBS, Human Lung Fibroblasts | <0.05 | <0.05 | ↔ | NS | ||
| BAL IL-13 | 10 (Fresh) and 7 (Frozen) | Human Bone Marrow | 0 | 1 × 10^6 viable MSC cells | Frozen MSCs washed 3 times prior to use | Naïve (PBS model) | AHE +PBS, Human Lung Fibroblasts | <0.05 | <0.05 | ↔ | NS | ||
| BAL IL-13 | 6 | Murine Bone Marrow | 0 | 1 × 10^6 viable MSC cells | Frozen MSCs washed 3 times prior to use | Naïve (PBS model) | AHE +PBS, Human Lung Fibroblasts | <0.05 | <0.05 | ↔ | NS | ||
| BAL IL-17 | 10 (Fresh) and 7 (Frozen) | Human Bone Marrow | 0 | 1 × 10^6 viable MSC cells | Frozen MSCs washed 3 times prior to use | Naïve (PBS model) | AHE +PBS, Human Lung Fibroblasts | <0.05 | <0.05 | Fresh better | <0.05 | ||
| BAL IL-17 | 6 | Murine Bone Marrow | 0 | 1 × 10^6 viable MSC cells | Frozen MSCs washed 3 times prior to use | Naïve (PBS model) | AHE +PBS, Human Lung Fibroblasts | <0.05 | <0.05 | ↔ | NS | ||
| BAL KC | 10 (Fresh) and 7 (Frozen) | Human Bone Marrow | 0 | 1 × 10^6 viable MSC cells | Frozen MSCs washed 3 times prior to use | Naïve (PBS model) | AHE +PBS, Human Lung Fibroblasts | <0.05 | <0.05 | Fresh better | <0.05 | ||
| BAL KC | 6 | Murine Bone Marrow | 0 | 1 × 10^6 viable MSC cells | Frozen MSCs washed 3 times prior to use | Naïve (PBS model) | AHE +PBS, Human Lung Fibroblasts | <0.05 | <0.05 | Frozen better | <0.05 | ||
| BAL RANTES | 10 (Fresh) and 7 (Frozen) | Human Bone Marrow | 0 | 1 × 10^6 viable MSC cells | Frozen MSCs washed 3 times prior to use | Naïve (PBS model) | AHE +PBS, Human Lung Fibroblasts | <0.05 | <0.05 | ↔ | NS | ||
| BAL RANTES | 6 | Murine Bone Marrow | 0 | 1 × 10^6 viable MSC cells | Frozen MSCs washed 3 times prior to use | Naïve (PBS model) | AHE +PBS, Human Lung Fibroblasts | <0.05 | <0.05 | ↔ | NS | ||
| IFN-y | 10 (Fresh) and 7 (Frozen) | Human Bone Marrow | 0 | 1 × 10^6 viable MSC cells | Frozen MSCs washed 3 times prior to use | Naïve (PBS model) | AHE +PBS, Human Lung Fibroblasts | <0.05 | <0.05 | ↔ | NS | ||
| IFN-y | 6 | Murine Bone Marrow | 0 | 1 × 10^6 viable MSC cells | Frozen MSCs washed 3 times prior to use | Naïve (PBS model) | AHE +PBS, Human Lung Fibroblasts | <0.05 | <0.05 | ↔ | NS | ||
| Curley et al., 2017 | Acute respiratory distress syndrome by intratracheal instillation of E. coli in rats. | Arterial Oxygenation (FiO2=0.3) | 8–10 | Human Umbilical Cord (Frozen) and Bone marrow (Fresh) MSCs | NR | 1×10^7 MSCs/kg | N/A | Sham model +PBS | E. coli+PBS | <0.05 | <0.05 | ↔ | NS |
| Arterial Oxygenation (FiO2=1) | 8–10 | Human Umbilical Cord (Frozen) and Bone marrow (Fresh) MSCs | NR | 1×10^7 MSCs/kg | N/A | Sham model +PBS | E. coli+PBS | <0.05 | <0.05 | ↔ | NS | ||
| Lung Compliance | 8–10 | Human Umbilical Cord (Frozen) and Bone marrow (Fresh) MSCs | NR | 1×10^7 MSCs/kg | N/A | Sham model +PBS | E. coli+PBS | <0.05 | <0.05 | ↔ | NS | ||
| Wet:Dry Lung Ratio | 8–10 | Human Umbilical Cord (Frozen) and Bone marrow (Fresh) MSCs | NR | 1×10^7 MSCs/kg | N/A | Sham model +PBS | E. coli+PBS | <0.05 | <0.05 | ↔ | NS | ||
| BAL Neutrophils | 8–10 | Human Umbilical Cord (Frozen) and Bone marrow (Fresh) MSCs | NR | 1×10^7 MSCs/kg | N/A | Sham model +PBS | E. coli+PBS | <0.05 | <0.05 | ↔ | NS | ||
| BAL Bacteria | 8–10 | Human Umbilical Cord (Frozen) and Bone marrow (Fresh) MSCs | NR | 1×10^7 MSCs/kg | N/A | Sham model +PBS | E. coli+PBS | <0.05 | <0.05 | ↔ | NS | ||
| Bárcia et al., 2017 | 1) Chronic adjuvant-induced arthritis (AIA) model 2) Hindlimb ischemia model in mice | Arthritis Index | 6 | Human Umbilical Cord MSCs | 0 | 1.7×10^6 MSCs | Fresh MSCs were cryopreserved and then cultured for up to 5 days | Sham model +PBS | N/A | P<0.0001 | P<0.0001 | ↔ | NS |
| Left Paw Volume | 6 | Human Umbilical Cord MSCs | 0 | 1.7×10^6 MSCs | Fresh MSCs were cryopreserved and then cultured for up to 5 days | Sham model +PBS | N/A | P<0.0001 | P<0.0001 | ↔ | NS | ||
| Right Paw Volume | 6 | Human Umbilical Cord MSCs | 0 | 1.7×10^6 MSCs | Fresh MSCs were cryopreserved and then cultured for up to 5 days | Sham model +PBS | N/A | P<0.0001 | P<0.0001 | ↔ | NS | ||
| Weight | 6 | Human Umbilical Cord MSCs | 0 | 1.7×10^6 MSCs | Fresh MSCs were cryopreserved and then cultured for up to 5 days | Sham model +PBS | N/A | P<0.0001 | P<0.0001 | ↔ | NS | ||
| Blood Flow Ratio in Hindlimb D0 | 12 | Human Umbilical Cord MSCs | 0 | 2×10^5 MSCs | Fresh MSCs were cryopreserved and then cultured for up to 5 days | N/A | PBS | NS | NS | ↔ | NS | ||
| Blood Flow Ratio in Hindlimb D7 | 12 | Human Umbilical Cord MSCs | 0 | 2×10^5 MSCs | Fresh MSCs were cryopreserved and then cultured for up to 5 days | N/A | PBS | P=0.008 | P=0.019 | ↔ | NS | ||
| Blood Flow Ratio in Hindlimb D14 | 12 | Human Umbilical Cord MSCs | 0 | 2×10^5 MSCs | Fresh MSCs were cryopreserved and then cultured for up to 5 days | N/A | PBS | P=0.012 | P=0.031 | ↔ | NS | ||
| Blood Flow Ratio in Hindlimb D21 | 12 | Human Umbilical Cord MSCs | 0 | 2×10^5 MSCs | Fresh MSCs were cryopreserved and then cultured for up to 5 days | N/A | PBS | P=0.004 | P=0.002 | ↔ | NS | ||
| Salmenkari et al., 2019 | Acute phase and Regenerative Phase of Colitis model in mice | Macroscopic Score | 9 | Human Bone Marrow | NR | 0.5 x 10^6 MSCs | N/A | Sham model with PBS | Colitis +Vehicle | PC: NS | PC: NS | ↔ | NS |
| Colon Weight (% change) | 9 | Human Bone Marrow | NR | 0.5 x 10^6 MSCs | N/A | Sham model with PBS | Colitis +Vehicle | PC: NS NC = P=0.001 | PC: NS NC: P=0.001 | ↔ | NS | ||
| Colon Length | 9 | Human Bone Marrow | NR | 0.5 x 10^6 MSCs | N/A | Sham model with PBS | Colitis +Vehicle | PC: NS NC = P=0.018 | PC: NS NC: P=0.014 | ↔ | NS | ||
| Histopathology Scpre | 9 | Human Bone Marrow | NR | 0.5 x 10^6 MSCs | N/A | Sham model with PBS | Colitis +Vehicle | PC: NS NC = P=0.004 | PC: NS NC: P=0.001 | ↔ | NS | ||
| Regeneration | 9 | Human Bone Marrow | NR | 0.5 x 10^6 MSCs | N/A | Sham model with PBS | Colitis +Vehicle | PC: NS | PC: NS | ↔ | NS | ||
| IL-1b in colon tissue homogenates | 9 | Human Bone Marrow | NR | 0.5 x 10^6 MSCs | N/A | Sham model with PBS | Colitis +Vehicle | PC: NS | PC: NS | ↔ | NS | ||
| TNFa in colon tissue homogenates | 9 | Human Bone Marrow | NR | 0.5 x 10^6 MSCs | N/A | Sham model with PBS | Colitis +Vehicle | PC: NS | PC: NS | ↔ | NS | ||
| IL-1b mRNA in colon | 9 | Human Bone Marrow | NR | 0.5 x 10^6 MSCs | N/A | Sham model with PBS | Colitis +Vehicle | PC: NS | PC: NS | ↔ | NS | ||
| Corticosterone in colon tissue homogenates | 9 | Human Bone Marrow | NR | 0.5 x 10^6 MSCs | N/A | Sham model with PBS | Colitis +Vehicle | PC: NS | PC: NS | ↔ | NS | ||
| Tissue ACE levels | 9 | Human Bone Marrow | NR | 0.5 x 10^6 MSCs | N/A | Sham model with PBS | Colitis +Vehicle | PC: NS | PC: P<0.05 | ↔ | NS | ||
| Atgr1a mRNA expression | 9 | Human Bone Marrow | NR | 0.5 x 10^6 MSCs | N/A | Sham model with PBS | Colitis +Vehicle | PC: NS | PC: NS | ↔ | NS | ||
| ACE shedding | 9 | Human Bone Marrow | NR | 0.5 x 10^6 MSCs | N/A | Sham model with PBS | Colitis +Vehicle | PC: NS | PC: P<0.001 | ↔ | NS | ||
| Somal et al., 2017 | Wound Healing of surgical dorsal limb wound in rats | Wound Area D0 | 3 | Caprine Amniotic Fluid | NR | 1 × 10^6 MSC cells | N/A | N/A | PBS | NS | NS | ↔ | NS |
| Wound Area D7 | 3 | Caprine Amniotic Fluid | NR | 1 × 10^6 MSC cells | N/A | N/A | PBS | P<0.05 | P<0.05 | ↔ | NS | ||
| Wound Area D14 | 3 | Caprine Amniotic Fluid | NR | 1 × 10^6 MSC cells | N/A | N/A | PBS | NS | NS | ↔ | NS | ||
| Wound Area D21 | 3 | Caprine Amniotic Fluid | NR | 1 × 10^6 MSC cells | N/A | N/A | PBS | NS | NS | ↔ | NS | ||
| Wound Area D28 | 3 | Caprine Amniotic Fluid | NR | 1 × 10^6 MSC cells | N/A | N/A | PBS | NS | NS | ↔ | NS | ||
| % Wound Contraction D7 | 3 | Caprine Amniotic Fluid | NR | 1 × 10^6 MSC cells | N/A | N/A | PBS | P<0.05 | NS | ↔ | NS | ||
| % Wound Contraction D14 | 3 | Caprine Amniotic Fluid | NR | 1 × 10^6 MSC cells | N/A | N/A | PBS | NS | NS | ↔ | NS | ||
| % Wound Contraction D21 | 3 | Caprine Amniotic Fluid | NR | 1 × 10^6 MSC cells | N/A | N/A | PBS | NS | NS | ↔ | NS | ||
| % Wound Contraction D28 | 3 | Caprine Amniotic Fluid | NR | 1 × 10^6 MSC cells | N/A | N/A | PBS | NS | NS | ↔ | NS | ||
| Epithelization | 3 | Caprine Amniotic Fluid | NR | 1 × 10^6 MSC cells | N/A | N/A | PBS | P<0.05 | P<0.05 | ↔ | NS | ||
| Neovascularization | 3 | Caprine Amniotic Fluid | NR | 1 × 10^6 MSC cells | N/A | N/A | PBS | P<0.05 | P<0.05 | ↔ | NS | ||
| Collagen Thickness | 3 | Caprine Amniotic Fluid | NR | 1 × 10^6 MSC cells | N/A | N/A | PBS | P<0.05 | P<0.05 | ↔ | NS | ||
| Collagen Density | 3 | Caprine Amniotic Fluid | NR | 1 × 10^6 MSC cells | N/A | N/A | PBS | P<0.05 | P<0.05 | ↔ | NS | ||
| Wound Area D0 | 3 | Caprine Amniotic Sac | NR | 1 × 10^6 MSC cells | N/A | N/A | PBS | NS | NS | ↔ | NS | ||
| Wound Area D7 | 3 | Caprine Amniotic Sac | NR | 1 × 10^6 MSC cells | N/A | N/A | PBS | NS | NS | ↔ | NS | ||
| Wound Area D14 | 3 | Caprine Amniotic Sac | NR | 1 × 10^6 MSC cells | N/A | N/A | PBS | NS | NS | ↔ | NS | ||
| Wound Area D21 | 3 | Caprine Amniotic Sac | NR | 1 × 10^6 MSC cells | N/A | N/A | PBS | NS | NS | ↔ | NS | ||
| Wound Area D28 | 3 | Caprine Amniotic Sac | NR | 1 × 10^6 MSC cells | N/A | N/A | PBS | NS | NS | ↔ | NS | ||
| % Wound Contraction D7 | 3 | Caprine Amniotic Sac | NR | 1 × 10^6 MSC cells | N/A | N/A | PBS | NS | NS | ↔ | NS | ||
| % Wound Contraction D14 | 3 | Caprine Amniotic Sac | NR | 1 × 10^6 MSC cells | N/A | N/A | PBS | NS | NS | ↔ | NS | ||
| % Wound Contraction D21 | 3 | Caprine Amniotic Sac | NR | 1 × 10^6 MSC cells | N/A | N/A | PBS | NS | NS | ↔ | NS | ||
| % Wound Contraction D28 | 3 | Caprine Amniotic Sac | NR | 1 × 10^6 MSC cells | N/A | N/A | PBS | NS | NS | ↔ | NS | ||
| Epithelization | 3 | Caprine Amniotic Sac | NR | 1 × 10^6 MSC cells | N/A | N/A | PBS | P<0.05 | P<0.05 | ↔ | NS | ||
| Neovascularization | 3 | Caprine Amniotic Sac | NR | 1 × 10^6 MSC cells | N/A | N/A | PBS | P<0.05 | P<0.05 | ↔ | NS | ||
| Collagen Thickness | 3 | Caprine Amniotic Sac | NR | 1 × 10^6 MSC cells | N/A | N/A | PBS | NS | P<0.05 | ↔ | NS | ||
| Collagen Density | 3 | Caprine Amniotic Sac | NR | 1 × 10^6 MSC cells | N/A | N/A | PBS | P<0.05 | P<0.05 | ↔ | NS | ||
| Wound Area D0 | 3 | Caprine Wharton’s Jelly | NR | 1 × 10^6 MSC cells | N/A | N/A | PBS | NS | NS | ↔ | NS | ||
| Wound Area D7 | 3 | Caprine Wharton’s Jelly | NR | 1 × 10^6 MSC cells | N/A | N/A | PBS | P<0.05 | NS | ↔ | NS | ||
| Wound Area D14 | 3 | Caprine Wharton’s Jelly | NR | 1 × 10^6 MSC cells | N/A | N/A | PBS | NS | NS | ↔ | NS | ||
| Wound Area D21 | 3 | Caprine Wharton’s Jelly | NR | 1 × 10^6 MSC cells | N/A | N/A | PBS | NS | NS | ↔ | NS | ||
| Wound Area D28 | 3 | Caprine Wharton’s Jelly | NR | 1 × 10^6 MSC cells | N/A | N/A | PBS | NS | NS | ↔ | NS | ||
| % Wound Contraction D7 | 3 | Caprine Wharton’s Jelly | NR | 1 × 10^6 MSC cells | N/A | N/A | PBS | P<0.05 | NS | ↔ | NS | ||
| % Wound Contraction D14 | 3 | Caprine Wharton’s Jelly | NR | 1 × 10^6 MSC cells | N/A | N/A | PBS | NS | NS | ↔ | NS | ||
| % Wound Contraction D21 | 3 | Caprine Wharton’s Jelly | NR | 1 × 10^6 MSC cells | N/A | N/A | PBS | NS | NS | ↔ | NS | ||
| % Wound Contraction D28 | 3 | Caprine Wharton’s Jelly | NR | 1 × 10^6 MSC cells | N/A | N/A | PBS | NS | NS | ↔ | NS | ||
| Epithelization | 3 | Caprine Wharton’s Jelly | NR | 1 × 10^6 MSC cells | N/A | N/A | PBS | P<0.05 | P<0.05 | ↔ | NS | ||
| Neovascularization | 3 | Caprine Wharton’s Jelly | NR | 1 × 10^6 MSC cells | N/A | N/A | PBS | P<0.05 | P<0.05 | ↔ | NS | ||
| Collagen Thickness | 3 | Caprine Wharton’s Jelly | NR | 1 × 10^6 MSC cells | N/A | N/A | PBS | P<0.05 | P<0.05 | ↔ | NS | ||
| Collagen Density | 3 | Caprine Wharton’s Jelly | NR | 1 × 10^6 MSC cells | N/A | N/A | PBS | P<0.05 | P<0.05 | ↔ | NS | ||
| Wound Area D0 | 3 | Caprine Cord Blood | NR | 1 × 10^6 MSC cells | N/A | N/A | PBS | NS | NS | ↔ | NS | ||
| Wound Area D7 | 3 | Caprine Cord Blood | NR | 1 × 10^6 MSC cells | N/A | N/A | PBS | P<0.05 | NS | ↔ | NS | ||
| Wound Area D14 | 3 | Caprine Cord Blood | NR | 1 × 10^6 MSC cells | N/A | N/A | PBS | NS | NS | ↔ | NS | ||
| Wound Area D21 | 3 | Caprine Cord Blood | NR | 1 × 10^6 MSC cells | N/A | N/A | PBS | NS | NS | ↔ | NS | ||
| Wound Area D28 | 3 | Caprine Cord Blood | NR | 1 × 10^6 MSC cells | N/A | N/A | PBS | NS | NS | ↔ | NS | ||
| % Wound Contraction D7 | 3 | Caprine Cord Blood | NR | 1 × 10^6 MSC cells | N/A | N/A | PBS | P<0.05 | NS | ↔ | NS | ||
| % Wound Contraction D14 | 3 | Caprine Cord Blood | NR | 1 × 10^6 MSC cells | N/A | N/A | PBS | NS | NS | ↔ | NS | ||
| % Wound Contraction D21 | 3 | Caprine Cord Blood | NR | 1 × 10^6 MSC cells | N/A | N/A | PBS | NS | NS | ↔ | NS | ||
| % Wound Contraction D28 | 3 | Caprine Cord Blood | NR | 1 × 10^6 MSC cells | N/A | N/A | PBS | NS | NS | ↔ | NS | ||
| Epithelization | 3 | Caprine Cord Blood | NR | 1 × 10^6 MSC cells | N/A | N/A | PBS | P<0.05 | P<0.05 | ↔ | NS | ||
| Neovascularization | 3 | Caprine Cord Blood | NR | 1 × 10^6 MSC cells | N/A | N/A | PBS | P<0.05 | P<0.05 | ↔ | NS | ||
| Collagen Thickness | 3 | Caprine Cord Blood | NR | 1 × 10^6 MSC cells | N/A | N/A | PBS | NS | NS | ↔ | NS | ||
| Collagen Density | 3 | Caprine Cord Blood | NR | 1 × 10^6 MSC cells | N/A | N/A | PBS | P<0.05 | NS | Frozen better | P<0.05 | ||
| Lohan et al., 2018 | Corneal Transplantation in rats | Opacity Score, measured from day 5 post-implantation to day 30 | Fresh = 13, Frozen = 10 | Rat Bone Marrow | 0 | 1×10^6 MSC | Frozen MSCs pre-treated with allogenic splenocytes, and co-intervention with MMF. No MMF for Fresh MSCs. | N/A | Transplantation +No treatment | NS | NS | ↔ | NR |
| Neovascularization Score, measured from day 5 post-implantation to day 30 | Fresh = 13, Frozen = 10 | Rat Bone Marrow | 0 | 1×10^6 MSC | Frozen MSCs pre-treated with allogenic splenocytes, and co-intervention with MMF. No MMF for Fresh MSCs. | N/A | Transplantation +No treatment | P<0.001 | NS | ↔ | NR | ||
| Gramlich et al., 2016 | Retinal ischemia/reperfusion model in mice | Retinal ganglion cells/mm^2 | Fresh = 10, Frozen = 8 | Human MSCs | <1 hr | 3×10^4 MSC | N/A | Sham model | PBS | P=0.019 | P=0.024 | ↔ | NS |
| Perlee et al., 2019 | Pneumosepsis Caused by Klebsiella pneumoniae | Lung Bacterial Load at 16 hours | 8 | Human Adipose Tissue | 0 | 1×10^6 ASCs | MSCs infused at 1 or 6 hours after infection. | N/A | PBS | NS | P<0.001 | ↔ | NS |
| Lung Bacterial Load at 48 hours | 8 | Human Adipose Tissue | 0 | 1×10^6 ASCs | MSCs infused at 1 or 6 hours after infection. | N/A | PBS | P<0.0001 | P<0.001 | ↔ | NS | ||
| Blood Bacterial Load at 16 hours | 8 | Human Adipose Tissue | 0 | 1×10^6 ASCs | MSCs infused at 1 or 6 hours after infection. | N/A | PBS | NS | NS | ↔ | NS | ||
| Blood Bacterial Load at 48 hours | 8 | Human Adipose Tissue | 0 | 1×10^6 ASCs | MSCs infused at 1 or 6 hours after infection. | N/A | PBS | P<0.001 | P<0.001 | ↔ | NS | ||
| Liver Bacterial Load at 16 hours | 8 | Human Adipose Tissue | 0 | 1×10^6 ASCs | MSCs infused at 1 or 6 hours after infection. | N/A | PBS | NS | NS | ↔ | NS | ||
| Liver Bacterial Load at 48 hours | 8 | Human Adipose Tissue | 0 | 1×10^6 ASCs | MSCs infused at 1 or 6 hours after infection. | N/A | PBS | P<0.0001 | P<0.001 | ↔ | NS | ||
| Spleen Bacterial Load at 16 hours | 8 | Human Adipose Tissue | 0 | 1×10^6 ASCs | MSCs infused at 1 or 6 hours after infection. | N/A | PBS | NS | NS | ↔ | NS | ||
| Spleen Bacterial Load at 48 hours | 8 | Human Adipose Tissue | 0 | 1×10^6 ASCs | MSCs infused at 1 or 6 hours after infection. | N/A | PBS | P<0.001 | P<0.01 | ↔ | NS | ||
| Lung TNFa at 16 hours | 8 | Human Adipose Tissue | 0 | 1×10^6 ASCs | MSCs infused at 1 or 6 hours after infection. | N/A | PBS | P<0.0001 | P<0.05 | ↔ | NS | ||
| Lung TNFa at 48 hours | 8 | Human Adipose Tissue | 0 | 1×10^6 ASCs | MSCs infused at 1 or 6 hours after infection. | N/A | PBS | P<0.001 | P<0.05 | ↔ | NS | ||
| Lung IL-1b at 16 hours | 8 | Human Adipose Tissue | 0 | 1×10^6 ASCs | MSCs infused at 1 or 6 hours after infection. | N/A | PBS | P<0.05 | P<0.01 | ↔ | NS | ||
| Lung IL-1b at 48 hours | 8 | Human Adipose Tissue | 0 | 1×10^6 ASCs | MSCs infused at 1 or 6 hours after infection. | N/A | PBS | P<0.001 | P<0.05 | ↔ | NS | ||
| Lung IL-6 at 16 hours | 8 | Human Adipose Tissue | 0 | 1×10^6 ASCs | MSCs infused at 1 or 6 hours after infection. | N/A | PBS | P<0.05 | P<0.01 | ↔ | NS | ||
| Lung IL-6 at 48 hours | 8 | Human Adipose Tissue | 0 | 1×10^6 ASCs | MSCs infused at 1 or 6 hours after infection. | N/A | PBS | P<0.01 | NS | ↔ | NS | ||
| MIP-2 at 16 hours | 8 | Human Adipose Tissue | 0 | 1×10^6 ASCs | MSCs infused at 1 or 6 hours after infection. | N/A | PBS | P<0.05 | P<0.01 | ↔ | NS | ||
| MIP-2 at 48 hours | 8 | Human Adipose Tissue | 0 | 1×10^6 ASCs | MSCs infused at 1 or 6 hours after infection. | N/A | PBS | P<0.001 | P<0.05 | ↔ | NS | ||
| Horie et al., 2020a | E. coli-induced lung injury. | Arterial Oxygenation | 8 | Human Umbilical Cord | 0 | 1 × 10^7 MSCs/kg | Isolated CD362+MSCs for use | N/A | PBS | P<0.05 | P<0.05 | ↔ | NS |
| Lung Wet:Dry Ratio | 8 | Human Umbilical Cord | 0 | 1 × 10^7 MSCs/kg | Isolated CD362+MSCs for use | N/A | PBS | NS | NS | ↔ | NS | ||
| Lung Compliance | 8 | Human Umbilical Cord | 0 | 1 × 10^7 MSCs/kg | Isolated CD362+MSCs for use | N/A | PBS | P<0.05 | NS | ↔ | NS | ||
| BAL E. coli Counts | 8 | Human Umbilical Cord | 0 | 1 × 10^7 MSCs/kg | Isolated CD362+MSCs for use | N/A | PBS | P<0.05 | P<0.05 | ↔ | NS | ||
| BAL WCC levels | 8 | Human Umbilical Cord | 0 | 1 × 10^7 MSCs/kg | Isolated CD362+MSCs for use | N/A | PBS | P<0.05 | P<0.05 | ↔ | NS | ||
| BAL Neutrophils | 8 | Human Umbilical Cord | 0 | 1 × 10^7 MSCs/kg | Isolated CD362+MSCs for use | N/A | PBS | P<0.05 | P<0.05 | ↔ | NS | ||
| BAL IL-1b | 8 | Human Umbilical Cord | 0 | 1 × 10^7 MSCs/kg | Isolated CD362+MSCs for use | N/A | PBS | P<0.05 | P<0.05 | ↔ | NS | ||
| BAL CINC-1 | 8 | Human Umbilical Cord | 0 | 1 × 10^7 MSCs/kg | Isolated CD362+MSCs for use | N/A | PBS | NS | NS | ↔ | NS | ||
| BAL IL-6 | 8 | Human Umbilical Cord | 0 | 1 × 10^7 MSCs/kg | Isolated CD362+MSCs for use | N/A | PBS | P<0.05 | P<0.05 | ↔ | NS | ||
| Horie et al., 2020a | Ventilator-induced Lung Injury | Arterial Oxygenation | Fresh, n=7–8; Cryopreserved, n=5– 6 | Human Bone Marrow | NR | 1×10^7 MSCs/ kg | Pre-activated MSCs (fresh and frozen were also used) | Sham model | PBS | P<0.001 | P<0.001 | ↔ | NS |
| Lung Compliance | Fresh, n=7–8; Cryopreserved, n=5– 6 | Human Bone Marrow | NR | 1×10^7 MSCs/ kg | Pre-activated MSCs (fresh and frozen were also used) | Sham model | PBS | NS | NS | ↔ | NS | ||
| Lung Wet:Dry Ratio | Fresh, n=7–8; Cryopreserved, n=5– 6 | Human Bone Marrow | NR | 1×10^7 MSCs/ kg | Pre-activated MSCs (fresh and frozen were also used) | Sham model | PBS | P<0.05 | P<0.05 | ↔ | NS | ||
| BAL Protein | Fresh, n=7–8; Cryopreserved, n=5– 6 | Human Bone Marrow | NR | 1×10^7 MSCs/ kg | Pre-activated MSCs (fresh and frozen were also used) | Sham model | PBS | NS | NS | ↔ | NS | ||
| Percentage of Alveolar Airspace | Fresh, n=8; Cryopreserved, n=6 | Human Bone Marrow | NR | 1×10^7 MSCs/ kg | Pre-activated MSCs (fresh and frozen were also used) | Sham model | PBS | P<0.001 | P<0.001 | ↔ | NS | ||
| BAL Neutrophils | Fresh, n=6–8; Cryopreserved, n=5–6 | Human Bone Marrow | NR | 1×10^7 MSCs/ kg | Pre-activated MSCs (fresh and frozen were also used) | Sham model | PBS | P<0.05 | P<0.01 | ↔ | NS | ||
| BAL CINC-1 | Fresh, n=6–8; Cryopreserved, n=5–6 | Human Bone Marrow | NR | 1×10^7 MSCs/ kg | Pre-activated MSCs (fresh and frozen were also used) | Sham model | PBS | P<0.05 | P<0.05 | ↔ | NS | ||
| BAL IL-6 | Fresh, n=6–8; Cryopreserved, n=5–6 | Human Bone Marrow | NR | 1×10^7 MSCs/ kg | Pre-activated MSCs (fresh and frozen were also used) | Sham model | PBS | P<0.05 | P<0.001 | ↔ | NS | ||
| BAL IL-10 | Fresh, n=6–8; Cryopreserved, n=5–6 | Human Bone Marrow | NR | 1×10^7 MSCs/ kg | Pre-activated MSCs (fresh and frozen were also used) | Sham model | PBS | NS | NS | ↔ | NS | ||
| BAL KGF | Fresh, n=6–8; Cryopreserved, n=5–6 | Human Bone Marrow | NR | 1×10^7 MSCs/ kg | Pre-activated MSCs (fresh and frozen were also used) | Sham model | PBS | NS | NS | ↔ | NS | ||
| BAL PGE2 | Fresh, n=6–8; Cryopreserved, n=5–6 | Human Bone Marrow | NR | 1×10^7 MSCs/ kg | Pre-activated MSCs (fresh and frozen were also used) | Sham model | PBS | NS | NS | ↔ | NS | ||
| Tan et al., 2019 | Polymicrobial sepsis induced by cecal-ligation-and-puncture (CLP) | %CD11b+/E. coli+cells in Peritoneal Fluid | Fresh, n=12; Cryopreserved, n=11 | Human Bone Marrow | 0 | 2.5×10^5 MSC cells | N/A | Sham model | PBS | P<0.0001 | P<0.0001 | ↔ | NS |
| Peritoneal CFU # | Fresh, n=12; Cryopreserved, n=11 | Human Bone Marrow | 0 | 2.5×10^5 MSC cells | N/A | Sham model | PBS | NS | NS | ↔ | NS | ||
| Plasma Lactate | Fresh, n=12; Cryopreserved, n=11 | Human Bone Marrow | 0 | 2.5×10^5 MSC cells | N/A | Sham model | PBS | P<0.05 | P<0.05 | ↔ | NS | ||
| Plasma CCL5 | Fresh, n=12; Cryopreserved, n=11 | Human Bone Marrow | 0 | 2.5×10^5 MSC cells | N/A | Sham model | PBS | NS | P<0.01 | ↔ | NS | ||
| Plasma JE | Fresh, n=12; Cryopreserved, n=11 | Human Bone Marrow | 0 | 2.5×10^5 MSC cells | N/A | Sham model | PBS | NS | NS | ↔ | NS | ||
| Plasma KC | Fresh, n=12; Cryopreserved, n=11 | Human Bone Marrow | 0 | 2.5×10^5 MSC cells | N/A | Sham model | PBS | P<0.05 | NS | ↔ | NS | ||
| Plasma LIX | Fresh, n=12; Cryopreserved, n=11 | Human Bone Marrow | 0 | 2.5×10^5 MSC cells | N/A | Sham model | PBS | NS | NS | ↔ | NS | ||
| Plasma IL-10 | Fresh, n=12; Cryopreserved, n=11 | Human Bone Marrow | 0 | 2.5×10^5 MSC cells | N/A | Sham model | PBS | NS | NS | ↔ | NS | ||
| Plasma IL-1b | Fresh, n=12; Cryopreserved, n=11 | Human Bone Marrow | 0 | 2.5×10^5 MSC cells | N/A | Sham model | PBS | NS | NS | ↔ | NS | ||
| Bharti et al., 2020 | Wound healing model with 2×2 cm^2 full-thickness excision skin wound in guinea pigs | Percent wound contraction D7 | 5 | Dog Bone Marrow | NR | 1×10^6 MSC cells | MSCs attached to polypropylene mesh of 2×2 cm2 size | N/A | Antibiotic only, Mesh only, and MSCs only as control groups | NS | NS | ↔ | NS |
| Percent wound contraction D14 | 5 | Dog Bone Marrow | NR | 1×10^6 MSC cells | MSCs attached to polypropylene mesh of 2×2 cm2 size | N/A | Antibiotic only, Mesh only, and MSCs only as control groups | P<0.05 | P<0.05 | ↔ | NS | ||
| Percent wound contraction D21 | 5 | Dog Bone Marrow | NR | 1×10^6 MSC cells | MSCs attached to polypropylene mesh of 2×2 cm2 size | N/A | Antibiotic only, Mesh only, and MSCs only as control groups | P<0.05 | P<0.05 | ↔ | NS | ||
| Percent wound contraction D28 | 5 | Dog Bone Marrow | NR | 1×10^6 MSC cells | MSCs attached to polypropylene mesh of 2×2 cm2 size | N/A | Antibiotic only, Mesh only, and MSCs only as control groups | P<0.05 | P<0.05 | ↔ | NS | ||
| Epithelialization | 5 | Dog Bone Marrow | NR | 1×10^6 MSC cells | MSCs attached to polypropylene mesh of 2×2 cm2 size | N/A | Antibiotic only, Mesh only, and MSCs only as control groups | P<0.05 | P<0.05 | ↔ | NS | ||
| Neovascularization | 5 | Dog Bone Marrow | NR | 1×10^6 MSC cells | MSCs attached to polypropylene mesh of 2×2 cm2 size | N/A | Antibiotic only, Mesh only, and MSCs only as control groups | P<0.05 | P<0.05 | ↔ | NS | ||
| Collagen Density | 5 | Dog Bone Marrow | NR | 1×10^6 MSC cells | MSCs attached to polypropylene mesh of 2×2 cm2 size | N/A | Antibiotic only, Mesh only, and MSCs only as control groups | P<0.05 | P<0.05 | ↔ | NS | ||
| Collagen Thickness | 5 | Dog Bone Marrow | NR | 1×10^6 MSC cells | MSCs attached to polypropylene mesh of 2×2 cm2 size | N/A | Antibiotic only, Mesh only, and MSCs only as control groups | P<0.05 | P<0.05 | ↔ | NS | ||
| Rogulska et al., 2019 | Wound Healing of Full-thickness excisional skin wounds in mice | Percent Wound Closure D3 | 14 | Human Adipose Tissue | 24 hours | 0.25‐0.3×10^6 cells in 50 μl | MSCs placed on 3D gel containing PPP, 0.2 M sucrose, 1% DMSO | N/A | Spontaneous healing, and 3D gel containing PPP, 0.2 M sucrose, 1% DMSO alone | P<0.05 | P<0.05 | ↔ | NS |
| Percent Wound Closure D7 | 14 | Human Adipose Tissue | 24 hours | 0.25‐0.3×10^6 cells in 50 μl | MSCs placed on 3D gel containing PPP, 0.2 M sucrose, 1% DMSO | N/A | Spontaneous healing, and 3D gel containing PPP, 0.2 M sucrose, 1% DMSO alone | P<0.05 | P<0.05 | ↔ | NS | ||
| Percent Wound Closure D14 | 14 | Human Adipose Tissue | 24 hours | 0.25‐0.3×10^6 cells in 50 μl | MSCs placed on 3D gel containing PPP, 0.2 M sucrose, 1% DMSO | N/A | Spontaneous healing, and 3D gel containing PPP, 0.2 M sucrose, 1% DMSO alone | P<0.05 | P<0.05 | ↔ | NS | ||
| Percent Wound Closure D28 | 14 | Human Adipose Tissue | 24 hours | 0.25‐0.3×10^6 cells in 50 μl | MSCs placed on 3D gel containing PPP, 0.2 M sucrose, 1% DMSO | N/A | Spontaneous healing, and 3D gel containing PPP, 0.2 M sucrose, 1% DMSO alone | P<0.05 | P<0.05 | ↔ | NS | ||
| Khan et al., 2019 | Acute Spinal Cord Injury in dogs | Motor activity of hind limbs assessed by using the canine Basso Beattie Bresnahan (cBBB) score at Week 1 | 4 | Dog Adipose Tissue | 0 | 1×10^7 MSC cells | Lentivirus Mediated HO-1 Gene Insertion into Ad- MSCs. | N/A | Fresh MSCs expressing GFP only. | NS | NS | ↔ | NS |
| cBBB score at Week 2 | 4 | Dog Adipose Tissue | 0 | 1×10^7 MSC cells | Lentivirus Mediated HO-1 Gene Insertion into Ad- MSCs. | N/A | Fresh MSCs expressing GFP only. | NS | NS | ↔ | NS | ||
| cBBB score at Week 3 | 4 | Dog Adipose Tissue | 0 | 1×10^7 MSC cells | Lentivirus Mediated HO-1 Gene Insertion into Ad- MSCs. | N/A | Fresh MSCs expressing GFP only. | NS | NS | ↔ | NS | ||
| cBBB score at Week 4 | 4 | Dog Adipose Tissue | 0 | 1×10^7 MSC cells | Lentivirus Mediated HO-1 Gene Insertion into Ad- MSCs. | N/A | Fresh MSCs expressing GFP only. | P<0.05 | NS | ↔ | NS | ||
| % age of gross lesion area | 4 | Dog Adipose Tissue | 0 | 1×10^7 MSC cells | Lentivirus Mediated HO-1 Gene Insertion into Ad- MSCs. | N/A | Fresh MSCs expressing GFP only. | NS | NS | ↔ | NS | ||
| Fibrotic areas relative to normal | 4 | Dog Adipose Tissue | 0 | 1×10^7 MSC cells | Lentivirus Mediated HO-1 Gene Insertion into Ad- MSCs. | Normal (no SCI) | Fresh MSCs expressing GFP only. | P<0.05 | NS | ↔ | NS | ||
| Myelinated areas relative to normal | 4 | Dog Adipose Tissue | 0 | 1×10^7 MSC cells | Lentivirus Mediated HO-1 Gene Insertion into Ad- MSCs. | Normal (no SCI) | Fresh MSCs expressing GFP only. | P<0.05 | NS | ↔ | NS | ||
| Yea et al., 2020 | Wound healing in rats | Total macroscopic score at 2 weeks | 4 | Human Umbilical Cord | NR | 1×10^6 MSC cells | N/A | Cryoprotectant and PBS | Fresh-MSCs | P=0.001 | P=0.04 | ↔ | NS |
| Total macroscopic score at 4 weeks | 4 | Human Umbilical Cord | NR | 1×10^6 MSC cells | N/A | Cryoprotectant and PBS | Fresh-MSCs | P=0.001 | P<0.05 | ↔ | NS | ||
| Total degeneration score at 2 weeks | 4 | Human Umbilical Cord | NR | 1×10^6 MSC cells | N/A | Cryoprotectant and PBS | Fresh-MSCs | P<0.001 | P<0.001 | ↔ | NS | ||
| Total degeneration score at 4 weeks | 4 | Human Umbilical Cord | NR | 1×10^6 MSC cells | N/A | Cryoprotectant and PBS | Fresh-MSCs | P<0.05 | P<0.05 | ↔ | NS | ||
| Fibre structure at 2 weeks | 4 | Human Umbilical Cord | NR | 1×10^6 MSC cells | N/A | Cryoprotectant and PBS | Fresh-MSCs | NS | NS | ↔ | NS | ||
| Fibre structure at 4 weeks | 4 | Human Umbilical Cord | NR | 1×10^6 MSC cells | N/A | Cryoprotectant and PBS | Fresh-MSCs | P<0.05 | P<0.05 | ↔ | NS | ||
| Fibre arrangement at 2 weeks | 4 | Human Umbilical Cord | NR | 1×10^6 MSC cells | N/A | Cryoprotectant and PBS | Fresh-MSCs | NS | NS | ↔ | NS | ||
| Fibre arrangement at 4 weeks | 4 | Human Umbilical Cord | NR | 1×10^6 MSC cells | N/A | Cryoprotectant and PBS | Fresh-MSCs | P<0.05 | P<0.05 | ↔ | NS | ||
| Rounding of nuclei at 2 weeks | 4 | Human Umbilical Cord | NR | 1×10^6 MSC cells | N/A | Cryoprotectant and PBS | Fresh-MSCs | NS | NS | ↔ | NS | ||
| Rounding of nuclei at 4 weeks | 4 | Human Umbilical Cord | NR | 1×10^6 MSC cells | N/A | Cryoprotectant and PBS | Fresh-MSCs | P<0.05 | P<0.05 | ↔ | NS | ||
| Variations in cellularity at 2 weeks | 4 | Human Umbilical Cord | NR | 1×10^6 MSC cells | N/A | Cryoprotectant and PBS | Fresh-MSCs | NS | NS | ↔ | NS | ||
| Variations in cellularity at 4 weeks | 4 | Human Umbilical Cord | NR | 1×10^6 MSC cells | N/A | Cryoprotectant and PBS | Fresh-MSCs | P<0.05 | P<0.05 | ↔ | NS | ||
| Decreased stainability at 2 weeks | 4 | Human Umbilical Cord | NR | 1×10^6 MSC cells | N/A | Cryoprotectant and PBS | Fresh-MSCs | NS | NS | ↔ | NS | ||
| Decreased stainability at 4 weeks | 4 | Human Umbilical Cord | NR | 1×10^6 MSC cells | N/A | Cryoprotectant and PBS | Fresh-MSCs | P<0.05 | P<0.05 | ↔ | NS | ||
| Hyalinization at 2 weeks | 4 | Human Umbilical Cord | NR | 1×10^6 MSC cells | N/A | Cryoprotectant and PBS | Fresh-MSCs | NS | NS | ↔ | NS | ||
| Hyalinization at 4 weeks | 4 | Human Umbilical Cord | NR | 1×10^6 MSC cells | N/A | Cryoprotectant and PBS | Fresh-MSCs | P<0.05 | P<0.05 | ↔ | NS | ||
| Inflammation at 2 weeks | 4 | Human Umbilical Cord | NR | 1×10^6 MSC cells | N/A | Cryoprotectant and PBS | Fresh-MSCs | NS | NS | ↔ | NS | ||
| Inflammation at 4 weeks | 4 | Human Umbilical Cord | NR | 1×10^6 MSC cells | N/A | Cryoprotectant and PBS | Fresh-MSCs | P<0.05 | P<0.05 | ↔ | NS | ||
| Fibroblast density at 2 weeks | 4 | Human Umbilical Cord | NR | 1×10^6 MSC cells | N/A | Cryoprotectant and PBS | Fresh-MSCs | NS | NS | ↔ | NS | ||
| Fibroblast density at 4 weeks | 4 | Human Umbilical Cord | NR | 1×10^6 MSC cells | N/A | Cryoprotectant and PBS | Fresh-MSCs | P<0.05 | P<0.05 | ↔ | NS | ||
| Nuclear aspect ratio at 2 weeks | 4 | Human Umbilical Cord | NR | 1×10^6 MSC cells | N/A | Cryoprotectant and PBS | Fresh-MSCs | NS | NS | ↔ | NS | ||
| Nuclear aspect ration at 4 weeks | 4 | Human Umbilical Cord | NR | 1×10^6 MSC cells | N/A | Cryoprotectant and PBS | Fresh-MSCs | P<0.05 | P<0.05 | ↔ | NS | ||
| Nuclear orientation at 2 weeks | 4 | Human Umbilical Cord | NR | 1×10^6 MSC cells | N/A | Cryoprotectant and PBS | Fresh-MSCs | P<0.05 | P<0.05 | ↔ | NS | ||
| Nuclear orientation at 4 weeks | 4 | Human Umbilical Cord | NR | 1×10^6 MSC cells | N/A | Cryoprotectant and PBS | Fresh-MSCs | P<0.05 | P<0.05 | ↔ | NS | ||
| Collagen organization at 2 weeks | 4 | Human Umbilical Cord | NR | 1×10^6 MSC cells | N/A | Cryoprotectant and PBS | Fresh-MSCs | P<0.05 | P<0.05 | ↔ | NS | ||
| Collagen organization at 4 weeks | 4 | Human Umbilical Cord | NR | 1×10^6 MSC cells | N/A | Cryoprotectant and PBS | Fresh-MSCs | P<0.05 | P<0.05 | ↔ | NS | ||
| Collagen fibre coherence at 2 weeks | 4 | Human Umbilical Cord | NR | 1×10^6 MSC cells | N/A | Cryoprotectant and PBS | Fresh-MSCs | NS | NS | ↔ | NS | ||
| Collagen fibre coherence at 4 weeks | 4 | Human Umbilical Cord | NR | 1×10^6 MSC cells | N/A | Cryoprotectant and PBS | Fresh-MSCs | P<0.05 | P<0.05 | ↔ | NS | ||
| GAG-rich area at 2 weeks | 4 | Human Umbilical Cord | NR | 1×10^6 MSC cells | N/A | Cryoprotectant and PBS | Fresh-MSCs | P<0.05 | P<0.05 | ↔ | NS | ||
| GAG-rich area at 4 weeks | 4 | Human Umbilical Cord | NR | 1×10^6 MSC cells | N/A | Cryoprotectant and PBS | Fresh-MSCs | P<0.05 | P<0.05 | ↔ | NS | ||
| Ultimate failure load at 2 weeks | 8 | Human Umbilical Cord | NR | 1×10^6 MSC cells | N/A | Cryoprotectant and PBS | Fresh-MSCs | P<0.05 | P<0.05 | ↔ | NS | ||
| Ultimate failure load at 4 weeks | 8 | Human Umbilical Cord | NR | 1×10^6 MSC cells | N/A | Cryoprotectant and PBS | Fresh-MSCs | P<0.05 | P<0.05 | ↔ | NS | ||
| Tendon stiffness at 2 weeks | 8 | Human Umbilical Cord | NR | 1×10^6 MSC cells | N/A | Cryoprotectant and PBS | Fresh-MSCs | P<0.05 | P<0.05 | ↔ | NS | ||
| Tendon stiffness at 4 weeks | 8 | Human Umbilical Cord | NR | 1×10^6 MSC cells | N/A | Cryoprotectant and PBS | Fresh-MSCs | NS | NS | ↔ | NS | ||
| Ultimate stress at 2 weeks | 8 | Human Umbilical Cord | NR | 1×10^6 MSC cells | N/A | Cryoprotectant and PBS | Fresh-MSCs | P<0.05 | P<0.05 | ↔ | NS | ||
| Ultimate stress at 4 weeks | 8 | Human Umbilical Cord | NR | 1×10^6 MSC cells | N/A | Cryoprotectant and PBS | Fresh-MSCs | P<0.05 | P<0.05 | ↔ | NS | ||
| Cross-sectional area at 2 weeks | 8 | Human Umbilical Cord | NR | 1×10^6 MSC cells | N/A | Cryoprotectant and PBS | Fresh-MSCs | P<0.05 | P<0.05 | ↔ | NS | ||
| Cross-sectional area at 4 weeks | 8 | Human Umbilical Cord | NR | 1×10^6 MSC cells | N/A | Cryoprotectant and PBS | Fresh-MSCs | P<0.05 | P<0.05 | ↔ | NS | ||
| Horiuchi et al., 2021 | Osteoarthritis model in rats | Bioluminescence | 9 | Rat synovial MSCs | NR | 1×10^6 MSC cells | N/A | PBS | Fresh-MSCs | NR | NR | ↔ | NS |
| Tibia gross finding score | 9 | Rat synovial MSCs | NR | 1×10^6 MSC cells | N/A | PBS | Fresh-MSCs | P<0.05 | P<0.05 | ↔ | NS | ||
| Femur gross finding score | 9 | Rat synovial MSCs | NR | 1×10^6 MSC cells | N/A | PBS | Fresh-MSCs | P<0.05 | P<0.05 | ↔ | NS | ||
| Tibia OARSI score | 6 | Rat synovial MSCs | NR | 1×10^6 MSC cells | N/A | PBS | Fresh-MSCs | P<0.05 | P<0.05 | ↔ | NS | ||
| Femur OARSI score | 6 | Rat synovial MSCs | NR | 1×10^6 MSC cells | N/A | PBS | Fresh-MSCs | NS | NS | ↔ | NS | ||
| Horie et al., 2021 | Ventilator-Induced Lung Injury (VILI) model in rats | Arterial oxygenation | 7 | Human Umbilical Cord MSCs | NR | 1 × 10^7 MSCs/kg | N/A | PBS | Fresh MSCs | P<0.001 | P<0.001 | ↔ | NS |
| Static Lung Compliance | 7 | Human Umbilical Cord MSCs | NR | 1 × 10^7 MSCs/kg | N/A | PBS | Fresh MSCs | P<0.01 | P<0.01 | ↔ | NS | ||
| Wet:Dry Ratio | 7 | Human Umbilical Cord MSCs | NR | 1 × 10^7 MSCs/kg | N/A | PBS | Fresh MSCs | P<0.05 | P<0.05 | ↔ | NS | ||
| BAL Protein | 7 | Human Umbilical Cord MSCs | NR | 1 × 10^7 MSCs/kg | N/A | PBS | Fresh MSCs | P<0.01 | P<0.01 | ↔ | NS | ||
| BAL Cell count | 7 | Human Umbilical Cord MSCs | NR | 1 × 10^7 MSCs/kg | N/A | PBS | Fresh MSCs | P<0.01 | P<0.01 | ↔ | NS | ||
| BAL Neutrophil count | 7 | Human Umbilical Cord MSCs | NR | 1 × 10^7 MSCs/kg | N/A | PBS | Fresh MSCs | P<0.05 | P<0.05 | ↔ | NS | ||
| BAL IL-6 level | 7 | Human Umbilical Cord MSCs | NR | 1 × 10^7 MSCs/kg | N/A | PBS | Fresh MSCs | NS | P<0.05 | Frozen better | P<0.05 | ||
| BAL IL-1 level | 7 | Human Umbilical Cord MSCs | NR | 1 × 10^7 MSCs/kg | N/A | PBS | Fresh MSCs | P<0.05 | P<0.05 | ↔ | NS | ||
| % Airspace | 4 | Human Umbilical Cord MSCs | NR | 1 × 10^7 MSCs/kg | N/A | PBS | Fresh MSCs | P<0.001 | P<0.001 | ↔ | NS | ||
-
↔ indicates no statistically significant difference of Freshly-cultured and Cryopreserved MSCs.
-
NS indicates Not Significant- statistical analysis from individual studies did not yield significant difference between Freshly-cultured and Cryopreserved MSCs. NR = Not reported.
-
If direct comparison of Freshly-cultured vs. Cryopreserved MSC was not presented in the same graph by a study, the results and discussion sections of that study were used to judge efficacy of Freshly-cultured vs. Cryopreserved MSCs for the table above.
Table 5
Summary of similar in-vivo outcomes reported across studies.
| Outcome Measure | Study | Unit of Measurement | Number of samples (n) | Fresh MSC Mean | Fresh MSC Std Dev | Frozen MSC Mean | Frozen MSC Std Dev |
|---|---|---|---|---|---|---|---|
| Arterial Oxygenation0.128 | Curley et al., 2017 | mmHg | 8 to 10 | 217.77 | 77.93 | 242.75 | 84.14 |
| Devaney et al., 2015 | mmHg | 10 | 265.5 | 67.86 | 247.64 | 68.232 | |
| Horie et al., 2020a | mmHg | 8 | 73.084 | 11.526 | 69.148 | 9.222 | |
| Horie et al., 2021 | kPa | 7 | 16.52 | 0.85 | 16.86 | 1.10 | |
| Lung Compliance | Curley et al., 2017 | mL/mmHg | 8 to 10 | 0.862 | 0.082 | 0.818 | 0.098 |
| Devaney et al., 2015 | mL/mmHg | 12 | 0.82264 | 0.132 | 0.765 | 0.128 | |
| Horie et al., 2020a | mL/mmHg | 8 | 0.55939 | 0.089 | 0.451 | 0.531 | |
| Horie et al., 2021 | mL/cmH2O | 7 | 0.363 | 0.06 | 0.358 | 0.08 | |
| Wet:Dry Lung Ratio | Curley et al., 2017 | Ratio | 8 to 10 | 4.72779 | 0.188 | 4.77 | 0.157 |
| Horie et al., 2020a | Ratio | 8 | 4.7643 | 0.074 | 4.94 | 0.294 | |
| Horie et al., 2021 | Ratio | 7 | 5.21 | 0.36 | 5.32 | 0.42 | |
| BAL IL-6 levels | Devaney et al., 2015 | pg/ml | 12 | 348.93 | 207.5 | 363.22 | 142.5 |
| Horie et al., 2020a | pg/ml | 8 | 224.67 | 119.86 | 181.51 | 126.72 | |
| Horie et al., 2021 | pg/ml | 7 | 252.39 | 61.64 | 207.76 | 53.66 | |
| % of Wound Contraction on D7 | Somal et al., 2017 | Percentage | 3 | 60.076 | 16.67 | 55.679 | 12.755 |
| Bharti et al., 2020 | Percentage | 5 | 16.104 | 1.062 | 14.521 | 2.123 | |
| Rogulska et al., 2019 | Percentage | 14 | 51.402 | 5.741 | 52.069 | 4.94 | |
| % of Wound Contraction on D14 | Somal et al., 2017 | Percentage | 3 | 96.374 | 0.85 | 89.937 | 5.103 |
| Bharti et al., 2020 | Percentage | 5 | 67.363 | 1.69 | 71.537 | 2.123 | |
| Rogulska et al., 2019 | Percentage | 14 | 99.065 | 2.8 | 99.866 | 2.804 | |
| % of Wound Contraction on D21 | Somal et al., 2017 | Percentage | 3 | 99.85 | 0.681 | 98.515 | 2.89 |
| Bharti et al., 2020 | Percentage | 5 | 84.141 | 1.93 | 89.457 | 1.769 | |
| % of Wound Contraction on D28 | Somal et al., 2017 | Percentage | 3 | 100.433 | 100.288 | 0.681 | |
| Bharti et al., 2020 | Percentage | 5 | 99.583 | 0.885 | 99.415 | 0.885 |
Table 6
In vitro outcomes where freshly cultured vs. cryopreserved MSCs were compared directly.
| Study | Outcome | Assay Used | Number (n) | Type and Source of MSCs | Time of cell preparation without MSC (hr) | Time of outcome measurement from MSC intervention (hr) | Concentration of MSCs | Pre-Treatment of MSCs | Negative Control (NC) | Positive Control (PC) | p-value for Fresh MSCs vs. control | p-value for Frozen MSCs vs. control | Fresh or Frozen MSC more effective? | p-value for Fresh vs. Frozen comparison |
|---|---|---|---|---|---|---|---|---|---|---|---|---|---|---|
| Bárcia et al., 2017 | Viability | Trypan Blue | Fresh/Cultured (12); cryo <1 yr(12); cryo >3 yrs (5) | Human Umbilical Cord MSCs | N/A | 0 | NR | Fresh/Cultured MSCs were cryopreserved and then cultured for up to 5 days | N/A | N/A | N/A | N/A | ↔ | NS |
| Apoptosis | Annexin V (and flow cytometry) | N/A | Human Umbilical Cord MSCs | N/A | 2 | NR | Fresh/Cultured MSCs were cryopreserved and then cultured for up to 5 days | N/A | Cultured cells incubated with H2O2 (2 mmol/L) for 2 hr | NR | NR | ↔ | NS | |
| Angiogenesis: Number of master junctions (branching points) | Matrigel/Human umbilical vein endothelial cell (HUVEC) tube formation assay | 2 | Human Umbilical Cord MSCs | 1 | 16 | 1 × 10⁶ cells | Fresh/Cultured MSCs were cryopreserved and then cultured for up to 5 days; fresh and cryo co-cultured in basal media | N/A | HUVEC in Basal Media and HUVECs in Basal media with VEGF (100 ng/mL) | NR | NR | ↔ | NS | |
| Angiogenesis: segment/tube length | Matrigel/Human umbilical vein endothelial cell (HUVEC) tube formation assay | 2 | Human Umbilical Cord MSCs | 1 | 16 | 1 × 10⁶ cells | Fresh/Cultured MSCs were cryopreserved and then cultured for up to 5 days; fresh and cryo co-cultured in basal media | N/A | HUVEC in Basal Media and HUVECs in Basal media with VEGF (100 ng/mL) | NR | NR | ↔ | NS | |
| Angiogenesis:total mesh area | Matrigel/Human umbilical vein endothelial cell (HUVEC) tube formation assay | 2 | Human Umbilical Cord MSCs | 1 | 16 | 1 × 10⁶ cells | Fresh/Cultured MSCs were cryopreserved and then cultured for up to 5 days; fresh and cryo co-cultured in basal media | N/A | HUVEC in Basal Media and HUVECs in Basal media with VEGF (100 ng/mL) | NR | NR | ↔ | NS | |
| Gramlich et al., 2016 | Viability | TUNEL staining via Apo-Direct Apoptosis Detection Kit | 5 | Human MSCs | N/A | 24 | 30,000 MSCs | Both fresh and frozen cells were washed twice, resuspended in PBS and analyzed immediately or after 1 hr storage on wet ice | N/A | N/A | N/A | N/A | Fresh better | P<0.001 |
| Viability | TUNEL staining via Apo-Direct Apoptosis Detection Kit | 5 | Human MSCs | N/A | 48 | 30,000 MSCs | Both fresh and frozen cells were washed twice, resuspended in PBS and analyzed immediately or after 1 hr storage on wet ice | N/A | N/A | N/A | N/A | Fresh better | P<0.001 | |
| Viability | TUNEL staining via Apo-Direct Apoptosis Detection Kit | 5 | Human MSCs | N/A | 72 | 30,000 MSCs | Both fresh and frozen cells were washed twice, resuspended in PBS and analyzed immediately or after 1 hr storage on wet ice | N/A | N/A | N/A | N/A | Fresh better | P=0.002 | |
| Metabolic Activity (measured by XXT) | XTT Assay | 6 | Human MSCs | N/A | 24 | 15,000 MSCs | N/A | N/A | N/A | N/A | N/A | ↔ | NS P=0.352 | |
| Metabolic Activity (measured by XXT) | XTT Assay | 6 | Human MSCs | N/A | 48 | 15,000 MSCs | N/A | N/A | N/A | N/A | N/A | ↔ | NS P=0.312 | |
| Metabolic Activity (measured by XXT) | XTT Assay | 6 | Human MSCs | N/A | 72 | 15,000MSCs | N/A | N/A | N/A | N/A | N/A | ↔ | NS P=0.971 | |
| IDO activity: unstimulated MSC | Concentration of kynurenine in conditioned media | 6 | Human MSC | N/A | 48 | NR | N/A | N/A | N/A | N/A | N/A | ↔ | NS P=0.998 | |
| IDO activity:MSC exposed to IFN-y | Concentration of kynurenine in conditioned media | 6 | Human MSC | N/A | 48 | NR | N/A | N/A | N/A | N/A | N/A | ↔ | NS P=0.099 | |
| IDO activity: MSC exposed to IFN-y+TNF a | Concentration of kynurenine in conditioned media | 6 | Human MSC | N/A | 48 | NR | N/A | N/A | N/A | N/A | N/A | ↔ | NS P=0.951 | |
| GDF-15: unstimulated | Human Growth Factor Array Q1 | 4 | Human MSC | N/A | 48 | 200,000 MSCs | N/A | N/A | Media Control | N/A | N/A | Frozen better | P=0.01 | |
| GDF-15: stimulated with IFN-y/TNF-a | Human Growth Factor Array Q1 | 4 | Human MSC | N/A | 48 | 200,000 MSCs | N/A | N/A | Media Control | N/A | N/A | ↔ | NS P=0.99 | |
| IGFBP-2: unstimulated | Human Growth Factor Array Q1 | 4 | Human MSC | N/A | 48 | 200,000 MSCs | N/A | N/A | Media Control | N/A | N/A | ↔ | NS P=0.32 | |
| IGFBP-2: stimulated with IFN-y/TNF-a | Human Growth Factor Array Q1 | 4 | Human MSC | N/A | 48 | 200,000 MSCs | N/A | N/A | Media Control | N/A | N/A | ↔ | NS P=0.68 | |
| IGFBP-3: unstimulated | Human Growth Factor Array Q1 | 4 | Human MSC | N/A | 48 | 200,000 MSCs | N/A | N/A | Media Control | N/A | N/A | ↔ | NS P=0.47 | |
| IGFBP-3: stimulated with IFN-y/TNF-a | Human Growth Factor Array Q1 | 4 | Human MSC | N/A | 48 | 200,000 MSCs | N/A | N/A | Media Control | N/A | N/A | ↔ | NS P=0.75 | |
| IGFBP-4: unstimulated | Human Growth Factor Array Q1 | 4 | Human MSC | N/A | 48 | 200,000 MSCs | N/A | N/A | Media Control | N/A | N/A | ↔ | NS P=0.39 | |
| IGFBP-6: unstimulated | Human Growth Factor Array Q1 | 4 | Human MSC | N/A | 48 | 200,000 MSCs | N/A | N/A | Media Control | N/A | N/A | ↔ | NS P=0.69 | |
| IGFBP-6: stimulated with IFN-y/TNF-a | Human Growth Factor Array Q1 | 4 | Human MSC | N/A | 48 | 200,000 MSCs | N/A | N/A | Media Control | N/A | N/A | Fresh better | P=0.03 | |
| Insulin: stimulated with IFN-y/TNF-a | Human Growth Factor Array Q1 | 4 | Human MSC | N/A | 48 | 200,000 MSCs | N/A | N/A | Media Control | N/A | N/A | ↔ | NS P=0.71 | |
| OPG: unstimulated | Human Growth Factor Array Q1 | 4 | Human MSC | N/A | 48 | 200,000 MSCs | N/A | N/A | Media Control | N/A | N/A | ↔ | NS P=0.39 | |
| OPG: stimulated with IFN-y/TNF-a | Human Growth Factor Array Q1 | 4 | Human MSC | N/A | 48 | 200,000 MSCs | N/A | N/A | Media Control | N/A | N/A | ↔ | NS P=0.65 | |
| PDGF-AA: unstimulated | Human Growth Factor Array Q1 | 4 | Human MSC | N/A | 48 | 200,000 MSCs | N/A | N/A | Media Control | N/A | N/A | ↔ | NS P=0.43 | |
| PDGF-AA: stimulated with IFN-y/TNF-a | Human Growth Factor Array Q1 | 4 | Human MSC | N/A | 48 | 200,000 MSCs | N/A | N/A | Media Control | N/A | N/A | Frozen better | P=0.04 | |
| PIGF: unstimulated | Human Growth Factor Array Q1 | 4 | Human MSC | N/A | 48 | 200,000 MSCs | N/A | N/A | Media Control | N/A | N/A | ↔ | NS P=0.83 | |
| SCF R: stimulated with IFN-y/TNF-a | Human Growth Factor Array Q1 | 4 | Human MSC | N/A | 48 | 200,000 MSCs | N/A | N/A | Media Control | N/A | N/A | ↔ | NS P=0.06 | |
| TGFb1: unstimulated | Human Growth Factor Array Q1 | 4 | Human MSC | N/A | 48 | 200,000 MSCs | N/A | N/A | Media Control | N/A | N/A | N/A | N/A | |
| TGFb1: stimulated with IFN-y/TNF-a | Human Growth Factor Array Q1 | 4 | Human MSC | N/A | 48 | 200,000 MSCs | N/A | N/A | Media Control | N/A | N/A | Fresh better | P=0.05 | |
| VEGF: unstimulated | Human Growth Factor Array Q1 | 4 | Human MSC | N/A | 48 | 200,000 MSCs | N/A | N/A | Media Control | N/A | N/A | ↔ | NS P=0.30 | |
| VEGF: stimulated with IFN-y/TNF-a | Human Growth Factor Array Q1 | 4 | Human MSC | N/A | 48 | 200,000 MSCs | N/A | N/A | Media Control | N/A | N/A | ↔ | NS P=0.96 | |
| Tan et al., 2019 | Viability | Trypan Blue | NR | Human BM | N/A | 0 | NR | N/A | N/A | N/A | N/A | N/A | ↔ | NS |
| Viability | Trypan Blue | NR | Human BM | N/A | 2 | NR | N/A | N/A | N/A | N/A | N/A | Fresh better | P<0.05 | |
| Viability | Trypan Blue | NR | Human BM | N/A | 4 | NR | N/A | N/A | N/A | N/A | N/A | ↔ | NS | |
| Viability | Trypan Blue | NR | Human BM | N/A | 6 | NR | N/A | N/A | N/A | N/A | N/A | ↔ | NS | |
| Viability (Viable Cells) | Annexin V+Propidium iodide (AV/PI) | NR | Human BM | N/A | 0 | NR | N/A | N/A | N/A | N/A | N/A | ↔ | NS | |
| Viability (Viable Cells) | Annexin V+Propidium iodide (AV/PI) | NR | Human BM | N/A | 2 | NR | N/A | N/A | N/A | N/A | N/A | ↔ | NS | |
| Viability (Viable Cells) | Annexin V+Propidium iodide (AV/PI) | NR | Human BM | N/A | 4 | NR | N/A | N/A | N/A | N/A | N/A | ↔ | NS | |
| Viability (Viable Cells) | Annexin V+Propidium iodide (AV/PI) | NR | Human BM | N/A | 6 | NR | N/A | N/A | N/A | N/A | N/A | Fresh better | P<0.05 | |
| Viability(Early apoptotic cells) | Annexin V+Propidium iodide (AV/PI) | NR | Human BM | N/A | 0 | NR | N/A | N/A | N/A | N/A | N/A | ↔ | NS | |
| Viability(Early apoptotic cells) | Annexin V+Propidium iodide (AV/PI) | NR | Human BM | N/A | 2 | NR | N/A | N/A | N/A | N/A | N/A | ↔ | NS | |
| Viability(Early apoptotic cells) | Annexin V+Propidium iodide (AV/PI) | NR | Human BM | N/A | 4 | NR | N/A | N/A | N/A | N/A | N/A | ↔ | NS | |
| Viability(Early apoptotic cells) | Annexin V+Propidium iodide (AV/PI) | NR | Human BM | N/A | 6 | NR | N/A | N/A | N/A | N/A | N/A | Fresh better | P<0.05 | |
| Viability (Late apoptotic cells) | Annexin V+Propidium iodide (AV/PI) | NR | Human BM | N/A | 0 | NR | N/A | N/A | N/A | N/A | N/A | ↔ | NS | |
| Viability (Late apoptotic cells) | Annexin V+Propidium iodide (AV/PI) | NR | Human BM | N/A | 2 | NR | N/A | N/A | N/A | N/A | N/A | ↔ | NS | |
| Viability (Late apoptotic cells) | Annexin V+Propidium iodide (AV/PI) | NR | Human BM | N/A | 4 | NR | N/A | N/A | N/A | N/A | N/A | Fresh better | P<0.05 | |
| Viability (Late apoptotic cells) | Annexin V+Propidium iodide (AV/PI) | NR | Human BM | N/A | 6 | NR | N/A | N/A | N/A | N/A | N/A | Fresh better | P<0.05 | |
| Phagocytosis | PBMCs pre-treated with LPS the co-culture with MSC at ratio of 1:5 for 24 hr | 3–6 | Human BM MSC: Donor 1 | N/A | 24 | NR | N/A | Naive PBMC | LPS treated PBMC | PC: P<0.0001 | PC: P<0.0001 | ↔ | NS | |
| Phagocytosis | PBMCs pre-treated with LPS the co-culture with MSC at ratio of 1:5 for 24 hr | 3–6 | Human BM MSC: Donor 2 | N/A | 24 | NR | N/A | Naive PBMC | LPS treated PBMC | NS | NS | ↔ | NS | |
| Phagocytosis | PBMCs pre-treated with LPS the co-culture with MSC at ratio of 1:5 for 24 hr | 3–6 | Human BM MSC: Donor 3 | N/A | 24 | NR | N/A | Naive PBMC | LPS treated PBMC | PC: P<0.001 | PC: P<0.001 | ↔ | NS | |
| Permeability | Endothelial cell (EC) treated with LPS for 6 hr then co-culture with MSC for 24 hr at ratio of 1:2 followed by adding FITC-dextran to the transwell insert | NR | Human BM MSC: Donor 1 | N/A | 24 | NR | N/A | Non-treated EC | LPS treated EC | PC: P<0.01 | PC: P<0.01 | ↔ | NS | |
| Permeability | Endothelial cell (EC) treated with LPS for 6 hr then co-culture with MSC for 24 hr at ratio of 1:2 followed by adding FITC-dextran to the transwell insert | NR | Human BM MSC: Donor 2 | N/A | 24 | NR | N/A | Non-treated EC | LPS treated EC | PC: P<0.01 | PC: P<0.01 | ↔ | NS | |
| Permeability | Endothelial cell (EC) treated with LPS for 6 hr then co-culture with MSC for 24 hr at ratio of 1:2 followed by adding FITC-dextran to the transwell insert | NR | Human BM MSC: Donor 3 | N/A | 24 | NR | N/A | Non-treated EC | LPS treated EC | PC: P<0.001 | PC: P<0.001 | ↔ | NS | |
| Bharti et al., 2020 | Growth Curve | Countess automated cell counter | NR | Canine BM | N/A | 24 | 1 × 10⁴ cells/ml | Frozen cells were thawed in distilled water at 36 °C for 45–60 s then enzymatically detached from mesh and added in re-warmed media with 15% FBS and washed twice at 1200 rpm for 5 min | N/A | N/A | N/A | N/A | ↔ | NS |
| Growth Curve | Countess automated cell counter | NR | Canine BM | N/A | 48 | 1 × 10⁴ cells/ml | Frozen cells were thawed in distilled water at 36 °C for 45–60 s then enzymatically detached from mesh and added in re-warmed media with 15% FBS and washed twice at 1200 rpm for 5 min | N/A | N/A | N/A | N/A | ↔ | NS | |
| Growth Curve | Countess automated cell counter | NR | Canine BM | N/A | 72 | 1 × 10⁴ cells/ml | Frozen cells were thawed in distilled water at 36 °C for 45–60 s then enzymatically detached from mesh and added in re-warmed media with 15% FBS and washed twice at 1200 rpm for 5 min | N/A | N/A | N/A | N/A | ↔ | NS | |
| Growth Curve | Countess automated cell counter | NR | Canine BM | N/A | 96 | 1 × 10⁴ cells/ml | Frozen cells were thawed in distilled water at 36 °C for 45–60 s then enzymatically detached from mesh and added in re-warmed media with 15% FBS and washed twice at 1200 rpm for 5 min | N/A | N/A | N/A | N/A | ↔ | NS | |
| Growth Curve | Countess automated cell counter | NR | Canine BM | N/A | 120 | 1 × 10⁴ cells/ml | Frozen cells were thawed in distilled water at 36 °C for 45–60 s then enzymatically detached from mesh and added in re-warmed media with 15% FBS and washed twice at 1200 rpm for 5 min | N/A | N/A | N/A | N/A | ↔ | NS | |
| Growth Curve | Countess automated cell counter | NR | Canine BM | N/A | 144 | 1 × 10⁴ cells/ml | Frozen cells were thawed in distilled water at 36 °C for 45–60 s then enzymatically detached from mesh and added in re-warmed media with 15% FBS and washed twice at 1200 rpm for 5 min | N/A | N/A | N/A | N/A | ↔ | NS | |
| Growth Curve | Countess automated cell counter | NR | Canine BM | N/A | 168 | 1 × 10⁴ cells/ml | Frozen cells were thawed in distilled water at 36 °C for 45–60 s then enzymatically detached from mesh and added in re-warmed media with 15% FBS and washed twice at 1200 rpm for 5 min | N/A | N/A | N/A | N/A | ↔ | NS | |
| Growth Curve | Countess automated cell counter | NR | Canine BM | N/A | 192 | 1 × 10⁴ cells/ml | Frozen cells were thawed in distilled water at 36 °C for 45–60 s then enzymatically detached from mesh and added in re-warmed media with 15% FBS and washed twice at 1200 rpm for 5 min | N/A | N/A | N/A | N/A | ↔ | NS | |
| Growth Curve | Countess automated cell counter | NR | Canine BM | N/A | 216 | 1 × 10⁴ cells/ml | Frozen cells were thawed in distilled water at 36 °C for 45–60 s then enzymatically detached from mesh and added in re-warmed media with 15% FBS and washed twice at 1200 rpm for 5 min | N/A | N/A | N/A | N/A | ↔ | NS | |
| Growth Curve | Countess automated cell counter | NR | Canine BM | N/A | 240 | 1 × 10⁴ cells/ml | Frozen cells were thawed in distilled water at 36 °C for 45–60 s then enzymatically detached from mesh and added in re-warmed media with 15% FBS and washed twice at 1200 rpm for 5 min | N/A | N/A | N/A | N/A | ↔ | NS | |
| Growth Curve | Countess automated cell counter | NR | Canine BM | N/A | 264 | 1 × 10⁴ cells/ml | Frozen cells were thawed in distilled water at 36 °C for 45–60 s then enzymatically detached from mesh and added in re-warmed media with 15% FBS and washed twice at 1200 rpm for 5 min | N/A | N/A | N/A | N/A | ↔ | NS | |
| Growth Curve | Countess automated cell counter | NR | Canine BM | N/A | 288 | 1 × 10⁴ cells/ml | Frozen cells were thawed in distilled water at 36 °C for 45–60 s then enzymatically detached from mesh and added in re-warmed media with 15% FBS and washed twice at 1200 rpm for 5 min | N/A | N/A | N/A | N/A | ↔ | NS | |
| Growth Curve | Countess automated cell counter | NR | Canine BM | N/A | 312 | 1 × 10⁴ cells/ml | Frozen cells were thawed in distilled water at 36 °C for 45–60 s then enzymatically detached from mesh and added in re-warmed media with 15% FBS and washed twice at 1200 rpm for 5 min | N/A | N/A | N/A | N/A | ↔ | NS | |
| CD 105 expression | Antibody assay | NR | Canine BM | N/A | Overnight | NR | Primary antibodies (1:100 dilutions) were used for localizing different markers (CD73, CD90, CD105, CD34) with an overnight incubation period at 4 °C. | N/A | N/A | N/A | N/A | ↔ | NS | |
| CD 90 expression | Antibody assay | NR | Canine BM | N/A | Overnight | NR | Primary antibodies (1:100 dilutions) were used for localizing different markers (CD73, CD90, CD105, CD34) with an overnight incubation period at 4 °C. | N/A | N/A | N/A | N/A | ↔ | NS | |
| CD 73 expression | Antibody assay | NR | Canine BM | N/A | Overnight | NR | Primary antibodies (1:100 dilutions) were used for localizing different markers (CD73, CD90, CD105, CD34) with an overnight incubation period at 4 °C. | N/A | N/A | N/A | N/A | ↔ | NS | |
| Population Doubling Time | N/A | NR | Canine BM | N/A | N/A | 1 × 10⁴ cells/ml | N/A | N/A | N/A | N/A | N/A | ↔ | NS | |
| Rogulska et al., 2019 | Metabolic Activity/Proliferation rate | Alamar Blue | 3 | Human Adipose | N/A | 48 | NR | MSCs culture in PS1D-based gel | N/A | N/A | N/A | N/A | Fresh better | P<0.05 |
| Metabolic Activity/Proliferation rate | Alamar Blue | 3 | Human Adipose | N/A | 96 | NR | MSCs culture in PS1D-based gel | N/A | N/A | N/A | N/A | Fresh better | P<0.05 | |
| Metabolic Activity/Proliferation rate | Alamar Blue | 3 | Human Adipose | N/A | 144 | NR | MSCs culture in PS1D-based gel | N/A | N/A | N/A | N/A | ↔ | NS | |
| Viability | Alamar Blue | 3 | Human Adipose | N/A | 24 | NR | N/A | N/A | N/A | N/A | N/A | Fresh better | P<0.05 | |
| Khan et al., 2019 | Antioxidant Concentration (2 fresh groups:GFP-MSC and HO-1 MSC) | Antioxidant Assay | 6 | Canine adipose | NR | NR | NR | Lentivirus-mediated GFP and HO-1 gene insertion into Ad-MSCs | N/A | N/A | N/A | N/A | Fresh better | P<0.05 |
| Yea et al., 2020 | Viability | Trypan Blue | 6 | Human Umbilical Cord | 0 | 0, 2, 4, 24, 48 hr | 1×10⁴ cells/well | None | N/A | N/A | N/A | N/A | ↔ | NS |
| Viability | Water-soluble tetrazolium salt (WST) assay | 6 | Human Umbilical Cord | 0 | 0, 2, 4, 24, 48 hr | 1×10^4 cells/well | None | N/A | N/A | N/A | N/A | ↔ | NS | |
| Population Doubling Time | Cell counting | 6 | Human Umbilical Cord | 0 | 4, 8, 12, 16, 20 days | 3×10^3 cells/cm^2 | None | N/A | N/A | N/A | N/A | ↔ | NS | |
| Horiuchi et al., 2021 | Biolumnescence | IVIS Lumina XRMS series III instrument (SPI, Tokyo, Japan) | 4 | Rat Synovial MSCs | 0 | Same day | Varying concentrations | None | N/A | N/A | N/A | N/A | ↔ | NS |
-
N/A = Not applicable (e.g. if the experiment set up did not include a particular variable). NR = Not reported (e.g. if a particular variable was part of the experiment set up but not explicitly reported on in results section or graph).
Table 7
Summary of all in vitro PBMC Proliferation assays from included studies.
| Study | MSCs Used | Solution | Addition to solution | Responder Cells | Fresh vs. Frozen Comparison | Duration of Culture | Proliferation Measurement | Ratio (MSC:Responder Cells) | |||||
|---|---|---|---|---|---|---|---|---|---|---|---|---|---|
| 1:1 | 1:3 | 1:6 | 1:10 | 1:12 | 1:50 | ||||||||
| Bárcia et al., 2017 | Cultured and Freshly-thawed MSCs were irradiated with 50 Gy prior to use | RPMI | 5% HEPES, 5% Pen-Strep, 5% NaPyr and 5% human serum | PBMC stimulated with anti-CD3, anti-CD28, and IL-2. | Yes | 16 hr | Percentage of T cells proliferation/ suppression | Yes | Yes | Yes | |||
| Gramlich et al., 2016 | Cultured and Freshly-thawed MSCs | RPMI | 10% (v/v) FBS, 1% (v/v) Penicillin/Streptomycin, and 1% (v/v) L-glutamine | PBMC stimulated with 250,000 Human T-activator CD3+/D28+Dynabeads | Yes | 144 hr | CFSE Cell Proliferation Kit | Yes | Yes | Yes | |||
| Tan et al., 2019 | Cultured and Freshly-thawed MSCs | NR | NR | PBMC stimulated with Dynabeads Human T-Activator CD3/CD28 | Yes | 120 hr | Yes | ||||||
Additional files
-
Supplementary file 1
Search strategy.
- https://cdn.elifesciences.org/articles/75053/elife-75053-supp1-v1.docx
-
Supplementary file 2
PRISMA checklist.
- https://cdn.elifesciences.org/articles/75053/elife-75053-supp2-v1.docx
-
Supplementary file 3
AGREE-II tool prompting questions.
- https://cdn.elifesciences.org/articles/75053/elife-75053-supp3-v1.docx
-
Supplementary file 4
Data collection items.
- https://cdn.elifesciences.org/articles/75053/elife-75053-supp4-v1.docx
-
MDAR checklist
- https://cdn.elifesciences.org/articles/75053/elife-75053-mdarchecklist1-v1.pdf
Download links
A two-part list of links to download the article, or parts of the article, in various formats.
Downloads (link to download the article as PDF)
Open citations (links to open the citations from this article in various online reference manager services)
Cite this article (links to download the citations from this article in formats compatible with various reference manager tools)
Comparison of freshly cultured versus cryopreserved mesenchymal stem cells in animal models of inflammation: A pre-clinical systematic review
eLife 11:e75053.
https://doi.org/10.7554/eLife.75053






