
First-principles model of optimal translation factors stoichiometry

- Department of Biology, Massachusetts Institute of Technology, United States
- Department of Physics, Massachusetts Institute of Technology, United States
Figures
Figure 1
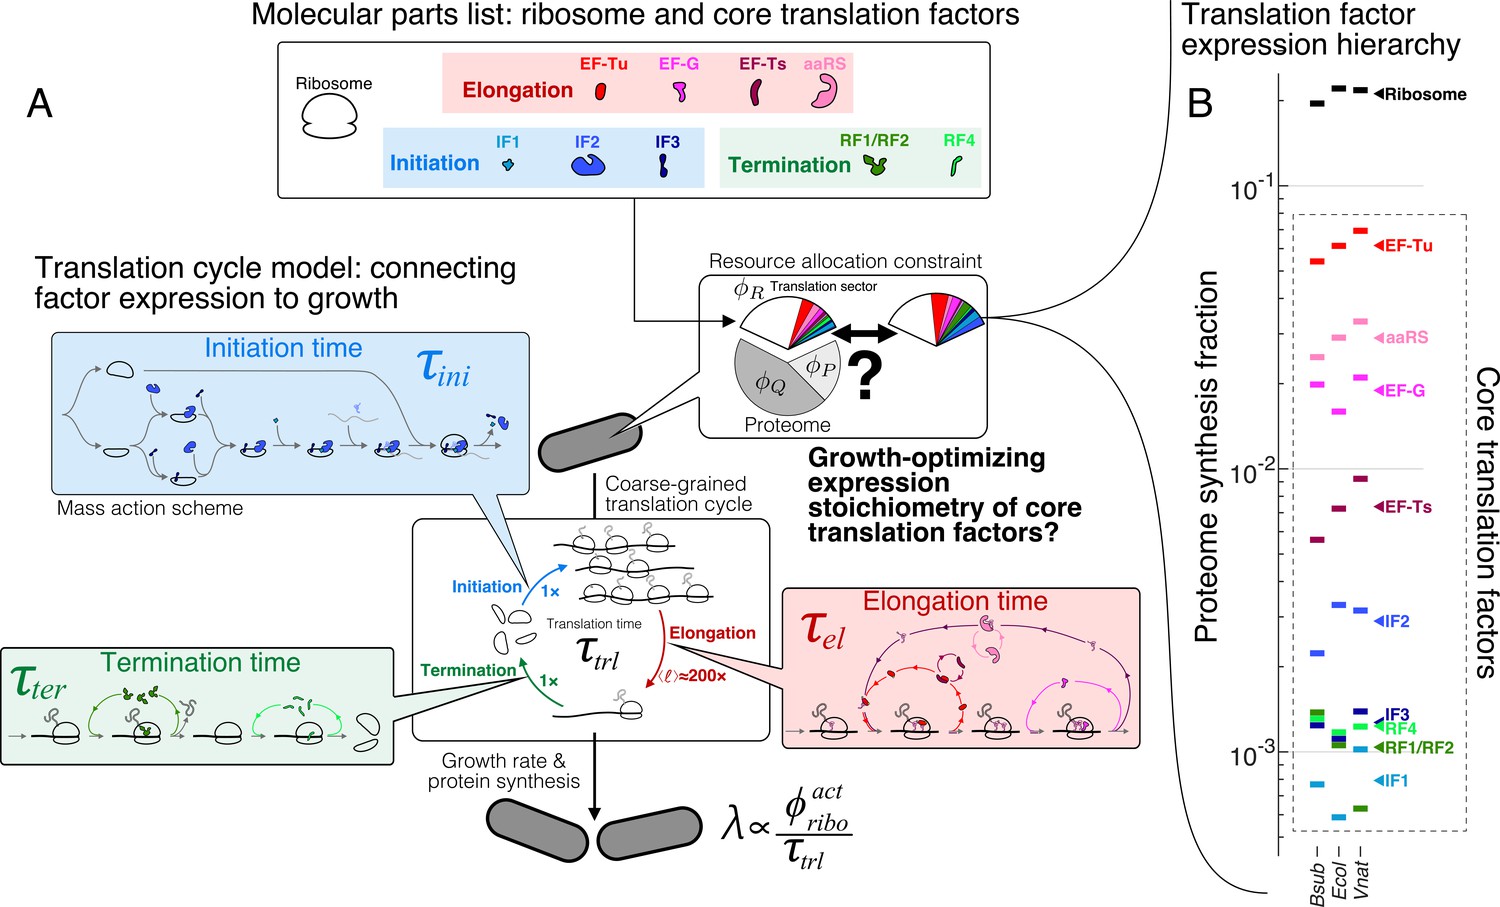
The hierarchy of mRNA translation factor expression stoichiometry.
(A) Multiscale model relating translation factor expression to growth rate. The growth rate λ is directly proportional to the active ribosome content () in the cell and inversely proportional to the average time to complete the translation cycle , consisting of the sum of the initiation (), elongation (), and termination () times. Each of these reaction times are determined by the translation factor abundances. On average, the elongation step is repeated around to complete a full protein, compared to 1 × for initiation and termination. Our framework of flux optimization under proteome allocation constraint addresses what ribosome and translation factor abundances maximize growth rate. (B) Measured expression hierarchy of bacterial mRNA translation factors, conserved across evolution. Horizontal bars mark the proteome synthesis fractions as measured by ribosome profiling (Lalanne et al., 2018) (equal to the proteome fraction by weight for a stable proteome) for key mRNA translation factors in B. subtilis (Bsub), E. coli (Ecol), and V. natriegens (Vnat) and are color-coded according to the protein (or group of proteins) specified. Triangles (◂) on the right indicate the mean synthesis fraction of the protein in the three species. See Table 1 for a short description of the translation factors considered. Synthesis fractions in (B) can be found in Supplementary file 1.
Figure 2
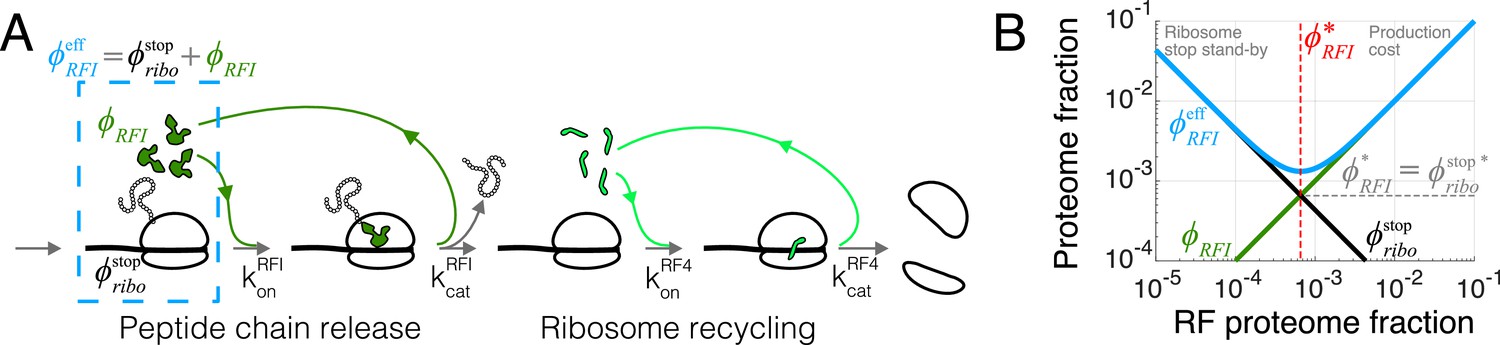
Case study with translation termination.
(A) Coarse-grained translation termination scheme. (B) Illustration of the minimization of effective proteome fraction corresponding to peptide chain release factors, leading to the equipartition principle.
Figure 3 with 1 supplement
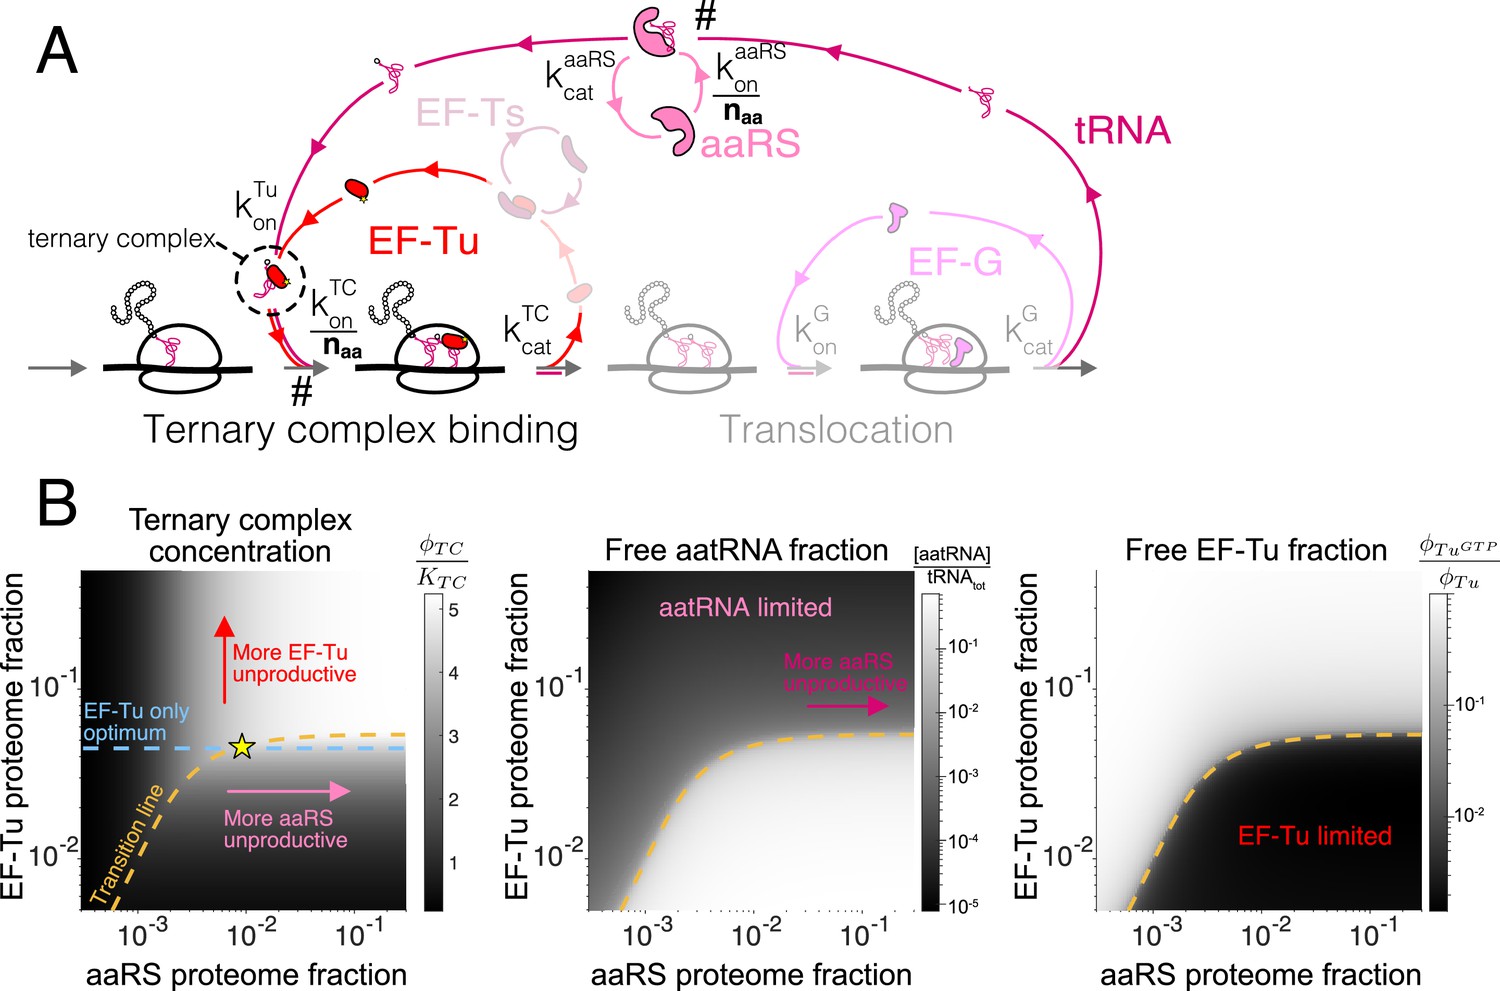
Case study with elongation factors (EF-Tu/aaRS).
(A) Schematic of the translation elongation scheme, with the tRNA cycle, involving aminoacyl-tRNA synthetases (aaRS) and EF-Tu. Reactions with a # have their association rate constants rescaled by a factor of through our coarse-graining to a single codon model. Greyed out cycles (EF-Ts and EF-G) can be solved in isolation (Appendix 3, sections Optimal EF-Ts abundance and Optimal EF-G abundance). (B) Exploration of the aaRS/EF-Tu expression space from numerical solution of the elongation model (Appendix 3, section Optimal EF-Tu and aaRS abundances). The transition line (orange) marks the boundary between the EF-Tu limited and aaRS limited regimes. Left panel shows the ternary complex concentration (which is closely related to the elongation rate, Equation 10). The ternary complex concentration is scaled by the dissociation constant to the ribosome A site (see Equation 39). Middle panel shows the free charged tRNA fraction. Right panel shows the free EF-Tu fraction ( denotes the proteome fraction of EF-Tu GTP that can bind to charged tRNAs to form the ternary complex). The star marks the optimal solution, as described in the text.
-
Figure 3—source code 1
Source code to obtain panel (B) can be found in the associated scripts submitted with this work.
- https://cdn.elifesciences.org/articles/69222/elife-69222-fig3-code1-v2.zip
Figure 3—figure supplement 1
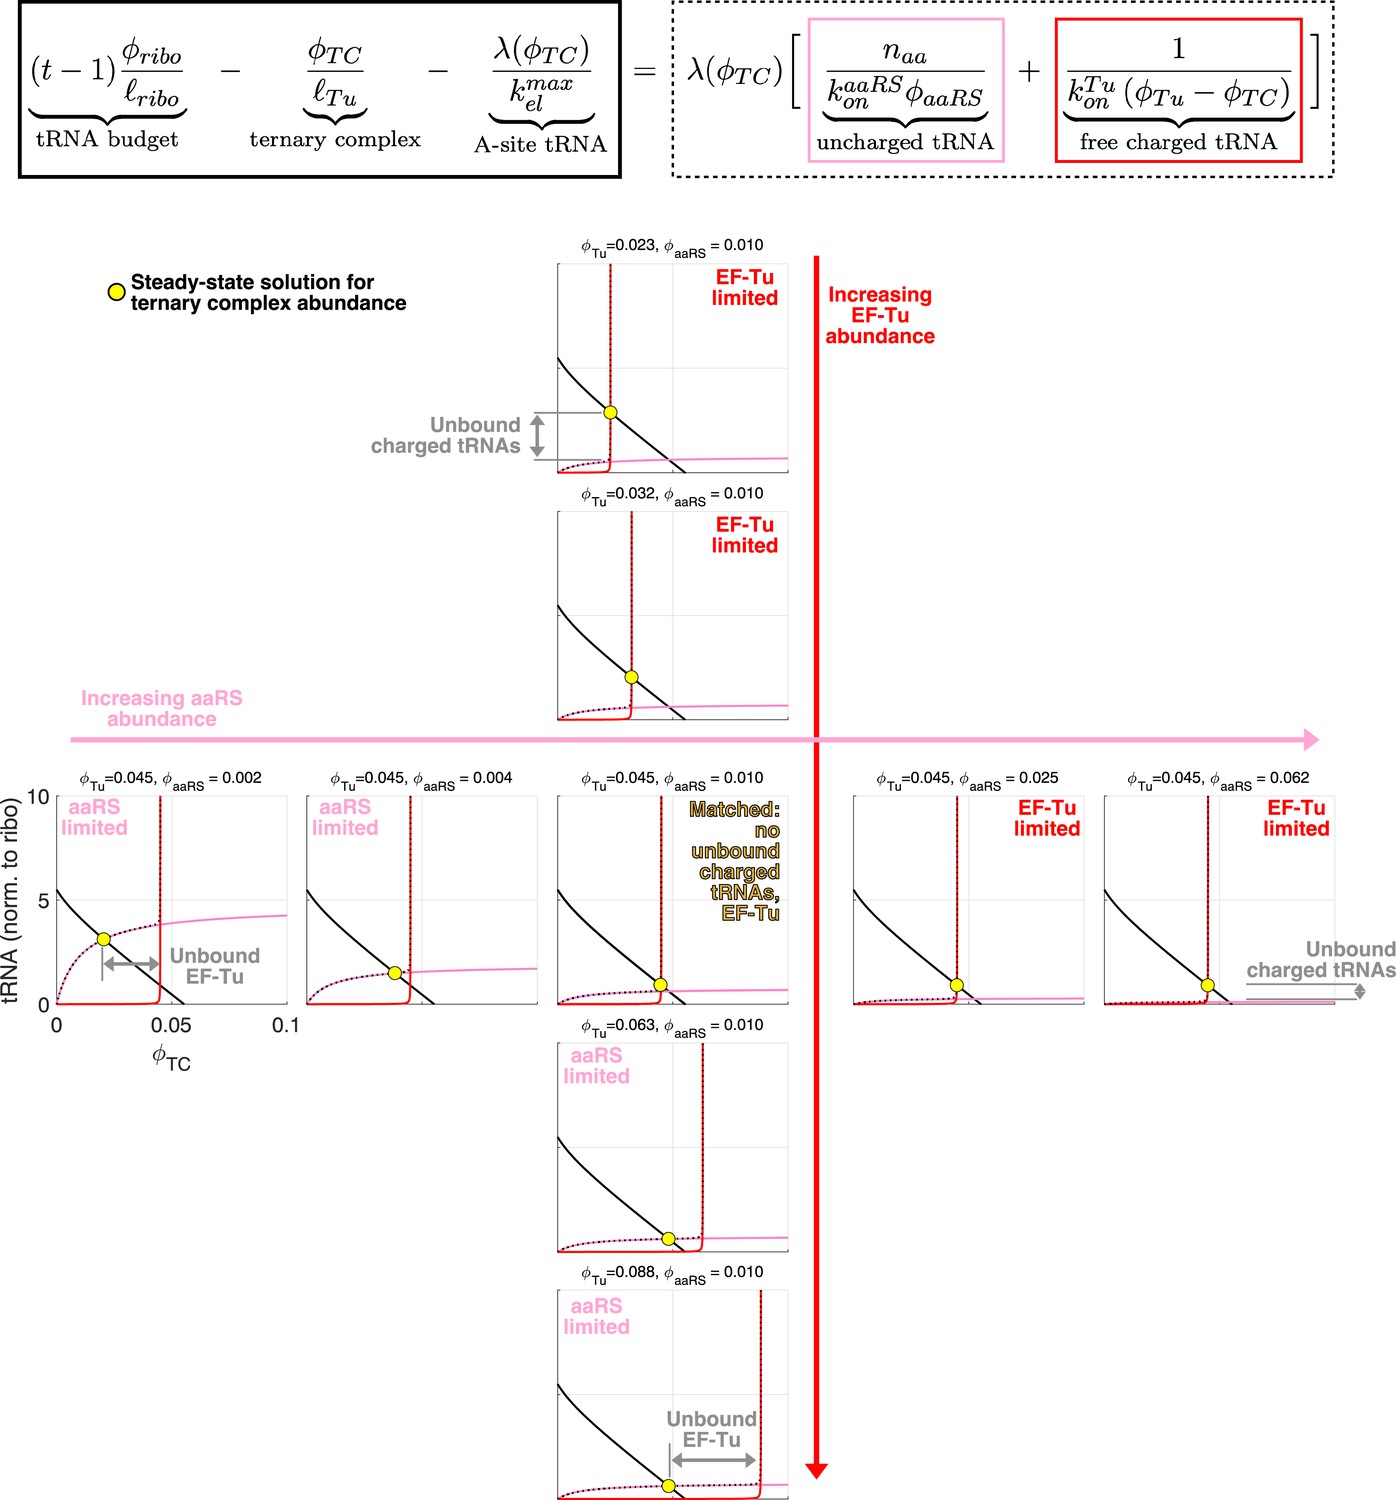
Geometrical interpretation of the sharpness of the separation of the aaRS limited and EF-Tu limited regimes.
Geometrical interpretation of the sharpness of the separation of the aaRS limited and EF-Tu limited regimes. Each graph corresponds to a different combination of aaRS and EF-Tu abundance. The solution for (yellow circle) corresponds to the intersection of the full (tRNA budget minus TC concentration and ribosome bound tRNAs) and dashed (all remaining tRNA contributions) black lines. Red and pink lines correspond to the free uncharged and charged tRNAs respectively. Because of the rapid divergence of the free charged tRNA term (red) at , the system shifts from being limited by aaRS-limited (pink line intersecting full black line) to being EF-Tu limited (red line intersect full black line) over a very narrow range in aaRS or EF-Tu expression change. The central graph corresponds to the abundance of EF-Tu and aaRS matched (no unbound charged tRNAs or EF-Tu), and falls on the transition line of Figure 3.
Figure 4 with 2 supplements
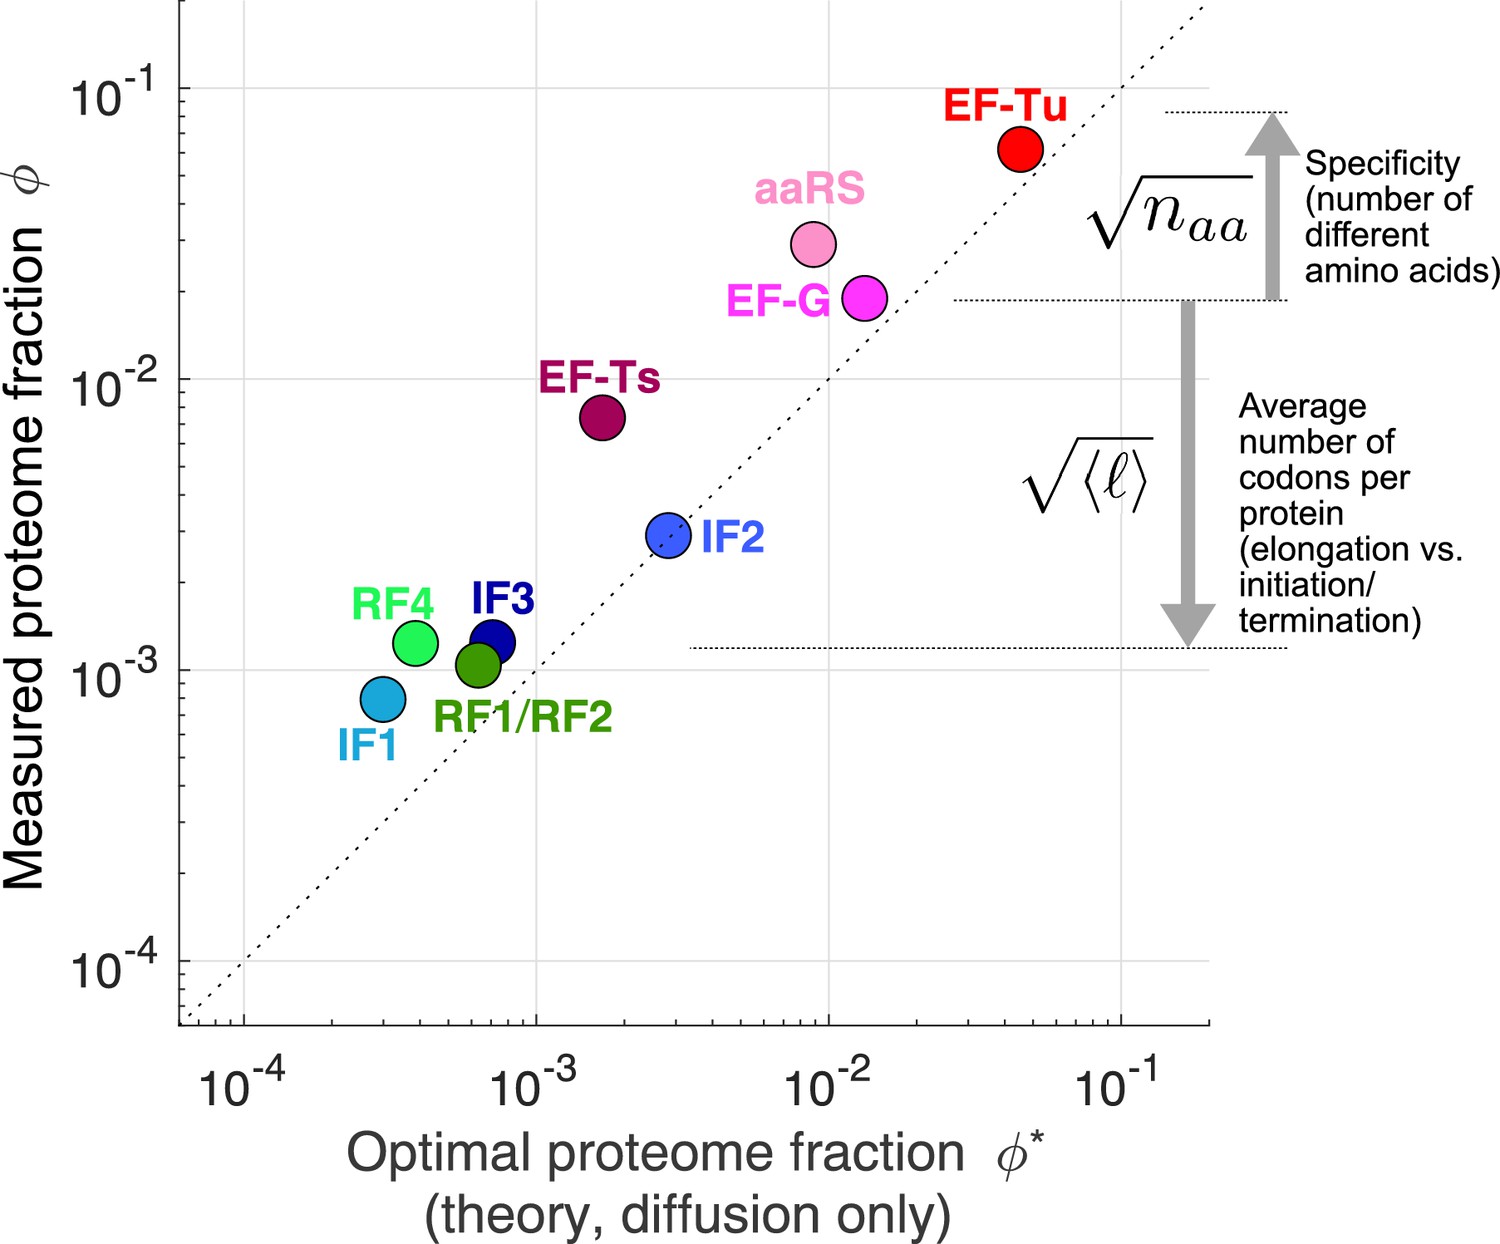
Predicted optimal abundance (no catalytic contribution, ) versus observed abundance.
Measured proteome fractions are the average of E. coli, B. subtilis, V. natriegens (Lalanne et al., 2018). We note that given the sensitivity of the optimal aaRS abundance on the total tRNA/ribosome ratio (visually: yellow star’s position in Figure 3B moves rapidly along x-axis upon changes in plateau of transition line), the prediction for aaRS should be interpreted with caution. Data and predicted values can be found in Supplementary file 1 and 2.
Figure 4—figure supplement 1
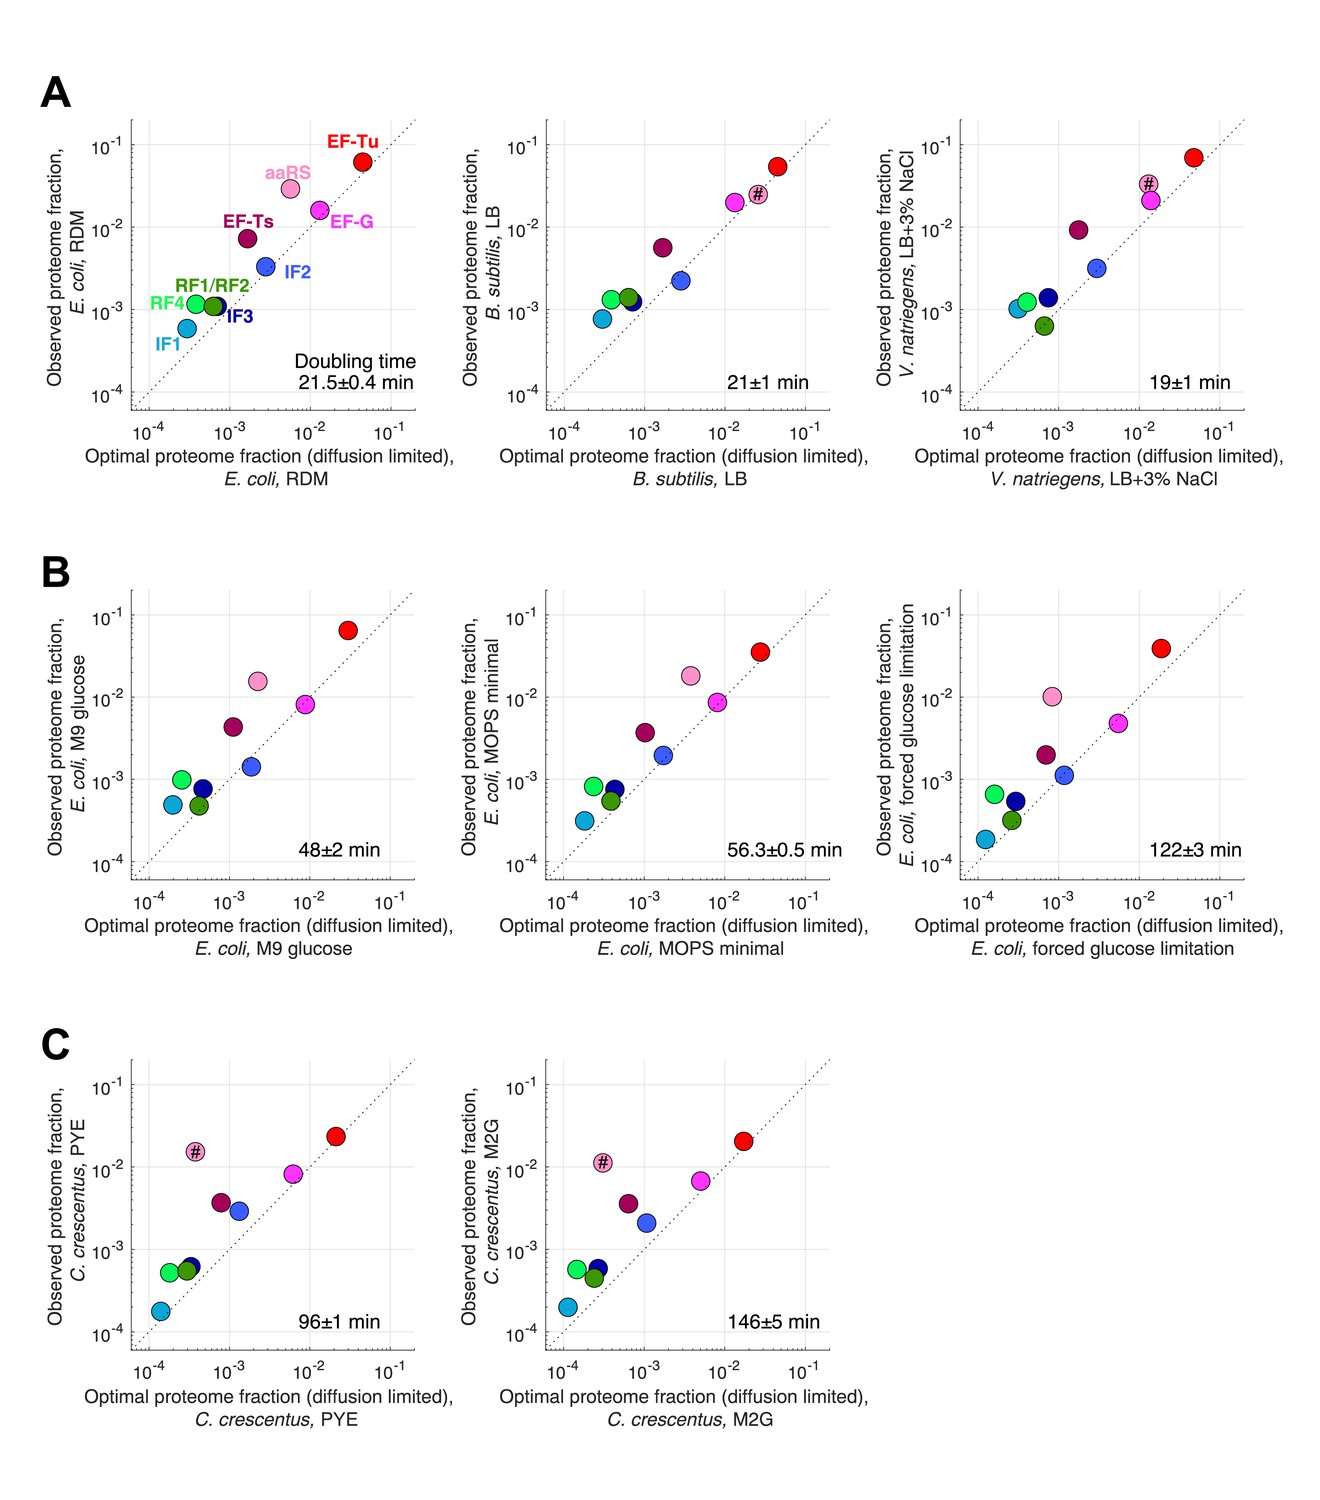
Measured and predicted proteome fraction for core translation factors in individual conditions.
Measured (ribosome profiling) and predicted (diffusion-limited estimates) proteome fraction for core translation factors in individual conditions corresponding to different ribosome profiling datasets included in our analysis (see Supplementary files 1–4). Doubling time for each condition is indicated. (A) Individual fast growing species (see Figure 4 for the average). (B) Slower growth conditions in E. coli. (C) C. crescentus datasets. Predictions of aaRS in species other than E. coli are marked by # to indicate that we used E. coli tRNA abundance measurements from Dong et al., 1996 to make prediction for this tlF these other species.
Figure 4—figure supplement 2
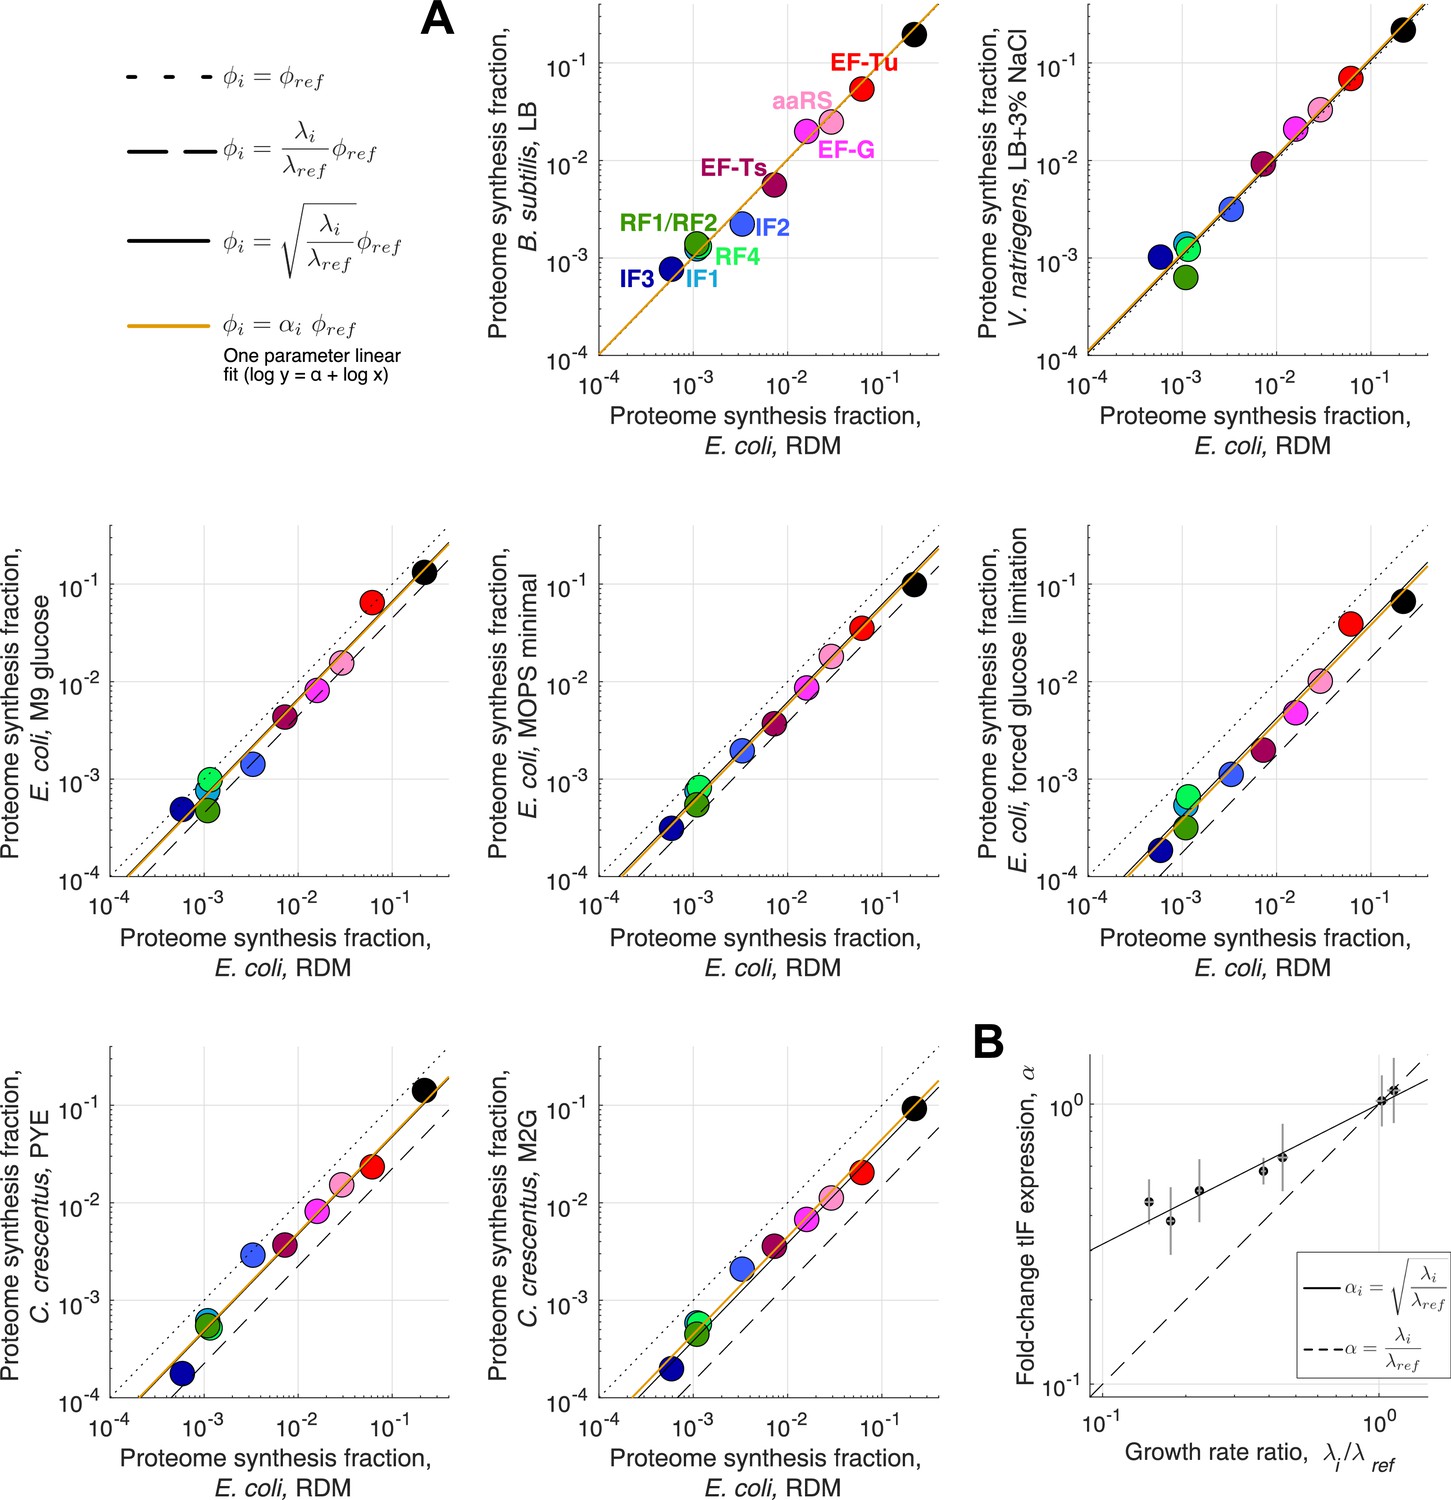
Expression stoichiometry of core translation factors in different species and at different growth rates.
Expression stoichiometry of core translation factors in different species and at different growth rates. (A) Comparison of measured (ribosome profiling) proteome fraction for core translation factors across different species and growth conditions (same conditions as Figure 4—figure supplement 1). All conditions are compared to the E. coli RDM dataset (reference: , condition of interest: ). Dotted line correspond to , dashed line to and full black line to (the parameter free prediction from the binding-limited regime of the model, optimal abundance ). Orange line corresponds to the one parameter fit (excluding aaRS, not expected to follow the square root scaling, and ribosomes), corresponding to the scaling of all factor’s abundance. (B) Best one-parameter fit (scale factor) from (A) as a function of the growth rate ratio . Square root scaling: full line. Linear scaling: dashed line. Uncertainties on the growth ratio are propagated from uncertainties of the respective growth rates. Uncertainties in are 95% confidence interval from the linear fits in (A).
Appendix 2—figure 1

Coarse-grained translation termination scheme with three stop codons and RF1/RF2.
Appendix 3—figure 1
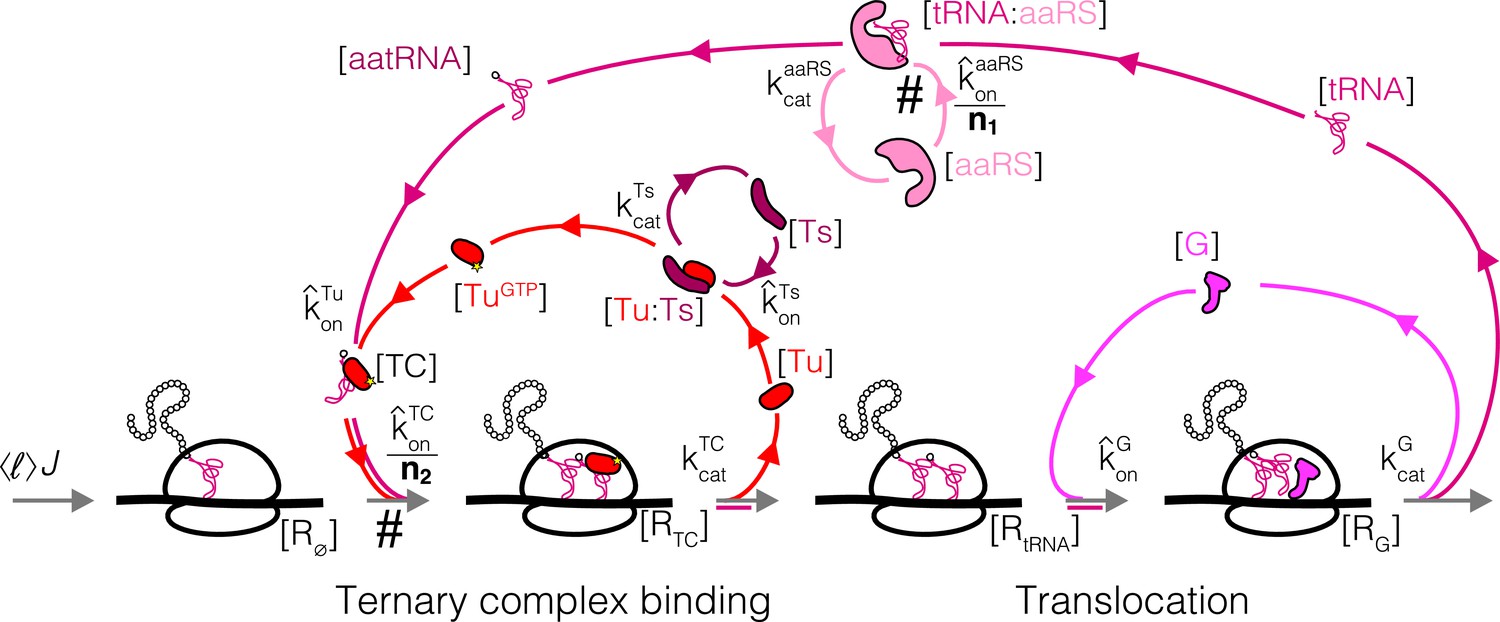
Coarse-grained reaction scheme for a single step (amino acid incorporation) of translation elongation.
Tu: EF-Tu, Ts: EF-Ts, G: EF-G, aaRS: aminoacyl tRNA synthetases. Steps with slower rates as a result of the coarse-graining to one effective codon are marked by #.
Appendix 3—figure 2
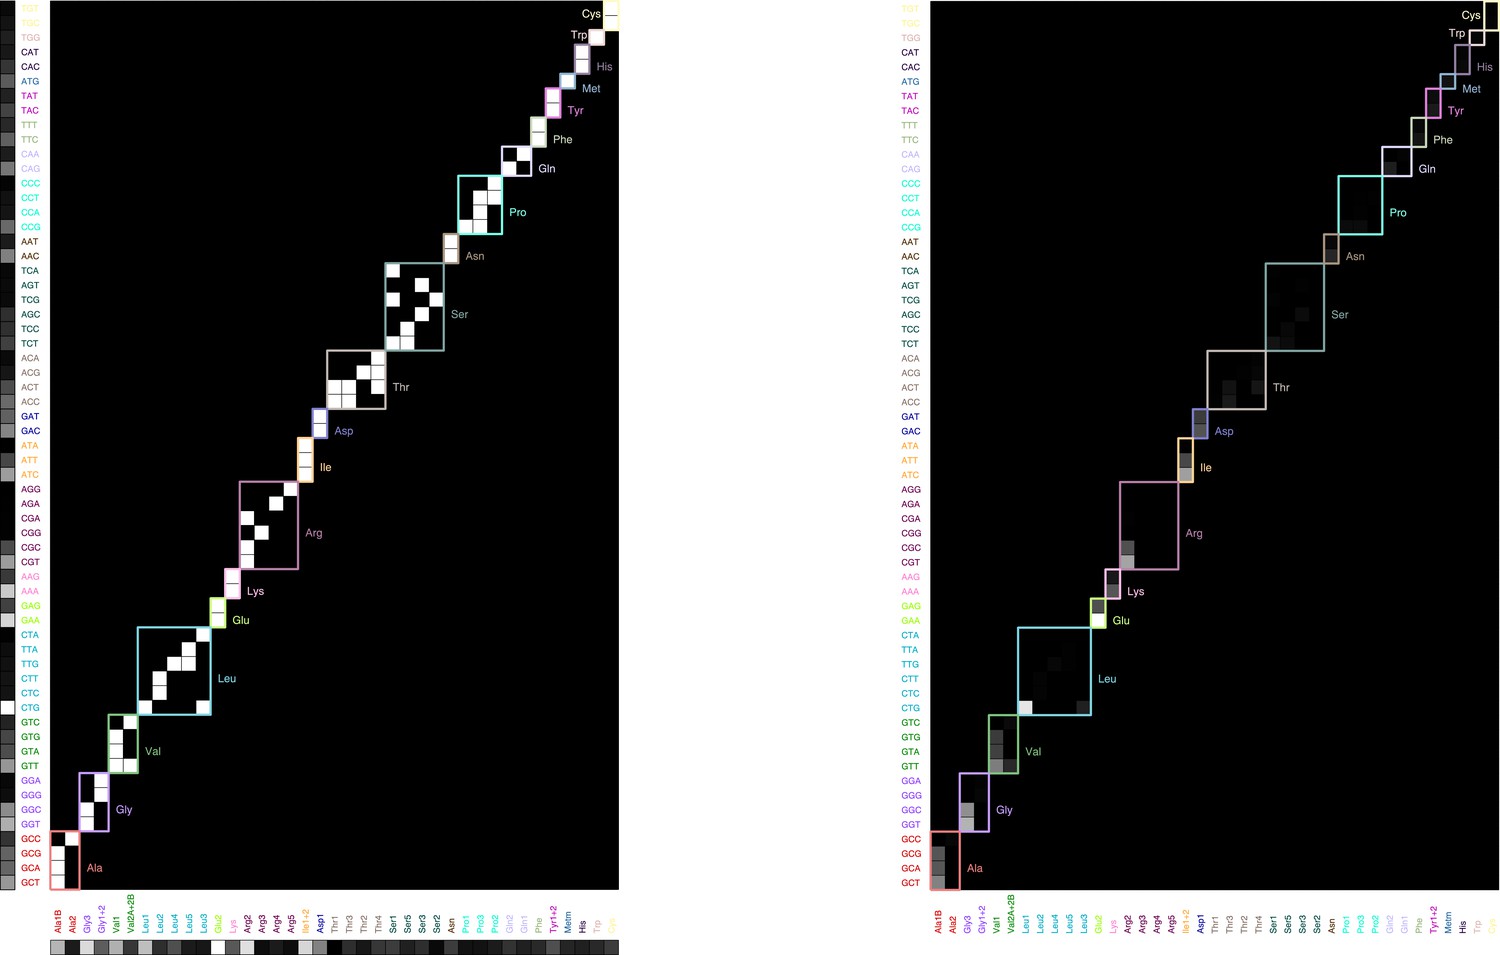
Graphical illustration of the sum (Equation 27).
Left: codon usage (vertical, from analysis of ribosome profiling data from Li et al., 2014), tRNA-codon specificity (matrix, from Björk and Hagervall, 2014, with different amino acids outlined with different colors), and tRNA abundance (horizontal, from Dong et al., 1996) organized by amino acid. Right: product matrix.
Appendix 4—figure 1
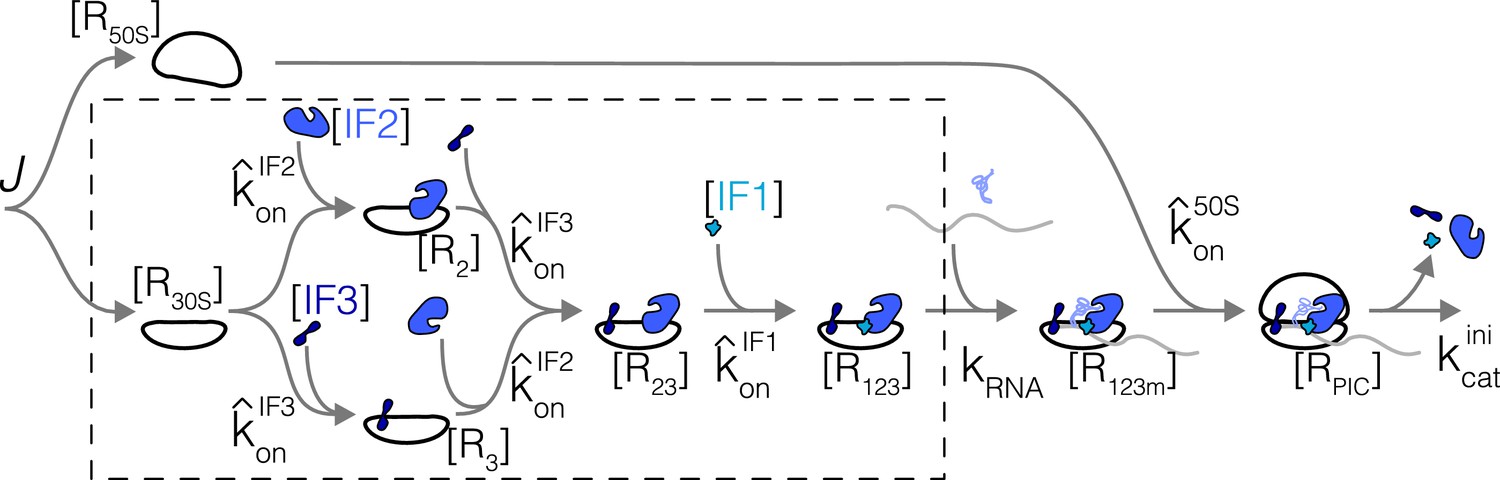
Simplified kinetic scheme for translation initiation.
Reactions in dashed box correspond to sub-system solved in detail first (section Sub-pathway without subunits joining). Variables are labeled on the scheme.
Tables
Table 1
Brief description of the function of core translation factors considered.
For reviews of mRNA translation, see Rodnina, 2018; Chen et al., 2016.
| Step | Factor | Function |
|---|---|---|
| Initiation | IF1 | Initiation factor 1: binds to 30S ribosome subunits to facilitate initiator tRNA binding (Laursen et al., 2005; Gualerzi and Pon, 2015). |
| Initiation | IF2 | Initiation factor 2: ribosome-dependent GTPase interacting with 30 ribosome subunits, ensures correct binding of initiator tRNAs (Laursen et al., 2005; Gualerzi and Pon, 2015). |
| Initiation | IF3 | Initiation factor 3: prevents premature docking of 50S ribosomal subunits (Laursen et al., 2005; Gualerzi and Pon, 2015). |
| Elongation | EF-Tu | Elongation factor Tu: binds to charged tRNAs to form ternary complexes, brings charged tRNAs to empty ribosome A sites. (Weijland et al., 1992; Agirrezabala and Frank, 2009; Andersen et al., 2003) |
| Elongation | aaRS | tRNA synthetases: charge tRNAs with cognate amino acids (Ibba and Soll, 2000; Pang et al., 2014). |
| Elongation | EF-G | Elongation factor G: catalyzes translocation steps of the ribosome after peptide bond formation (Andersen et al., 2003; Agirrezabala and Frank, 2009). |
| Elongation | EF-Ts | Elongation factor Ts: nucleotide exchange factor for EF-Tu (Agirrezabala and Frank, 2009; Andersen et al., 2003). |
| Termination | RF1/RF2 | Peptide chain release factors 1 and 2: recognize stop codon and hydrolyze the completed protein. RF1 recognizes UAA, UAG, and RF2 UAA, UGA (Bertram et al., 2001). |
| Termination | RF4 | Ribosome recycling factor: catalyzes the dissociation of ribosome subunits following peptide chain release in translation termination (Bertram et al., 2001). |
Table 2
Compilation of predicted optimal abundances for translation factors.
The optimal abundance is the sum of the terms in each row. Columns correspond to contributions of different nature (diffusion of factor itself, diffusion of other factors involved in the factor’s cycle, catalytic term). Terms must be multiplied by the common factors indicated in each column’s header (∝). For RF1+RF2, (see section Optimal abundances for RF1/RF2).
| Factor | Diffusion (direct) | Diffusion (other) | Catalytic sequestration |
|---|---|---|---|
| IF1 | |||
| IF2 | |||
| IF3 | |||
| EF-G | |||
| EF-Ts | |||
| EF-Tu | |||
| RF1+RF2 | |||
| RF4 |
Appendix 2—table 1
Chemical species and parameters in three stop codons termination model.
| Variable | Description |
|---|---|
| Ribosomes at UAA with peptide chain [µM] | |
| Ribosomes at UAG with peptide chain [µM] | |
| Ribosomes at UGA with peptide chain [µM] | |
| Ribosomes at UAA with peptide chain and RF1 bound [µM] | |
| Ribosomes at UAG with peptide chain and RF1 bound [µM] | |
| Ribosomes at UAA with peptide chain and RF2 bound [µM] | |
| Ribosomes at UGA with peptide chain and RF2 bound [µM] | |
| Ribosomes at all stops without peptide chain [µM] | |
| Ribosomes at all stops without peptide chain and RF4 bound [µM] | |
| Free RF1 [µM] | |
| Free RF2 [µM] | |
| Free RF4 [µM] | |
| Ribosome flux through UAA [µM s−1] | |
| Ribosome flux through UAG [µM s−1] | |
| Ribosome flux through UGA [µM s−1] | |
| On-rate for RF1 [µM−1 s−1] | |
| On-rate for RF2 [µM−1 s−1] | |
| On-rate for RF4 [µM−1 s−1] | |
| Catalytic rate for RF1 [s−1] | |
| Catalytic rate for RF2 [s−1] | |
| Catalytic rate for RF4 [s−1] | |
| Total RF1 [µM] | |
| Total RF2 [µM] | |
| Total RF4 [µM] |
Appendix 5—table 1
Protein sizes (number of codons) and diffusion coefficients.
Unless otherwise noted, number of codons per protein are taken for E. coli (Keseler et al., 2017) (ribosome size taken from Wittmann, 1982). #For the ternary complex, the total mass of tRNA+EF-Tu was converted to an equivalent amino acid length for the diffusion constant scaling estimate. †For aaRS, the size for the summed aaRSs is, from the coarse graining, , here with proteome fractions estimated from ribosome profiling (Li et al., 2014) in E. coli and sizes accounting for varying complex stoichiometries. Measured diffusion coefficients are taken from: Bakshi et al., 2012; Sanamrad et al., 2014 for the ribosome, from Plochowietz et al., 2017; Volkov et al., 2018 for tRNAs, and from Volkov et al., 2018 for the TC.
| Factor | Number of codon per protein | Diffusion coefficient (µm2 s−1) |
|---|---|---|
| Ribosome | ||
| 30S subunit | ||
| TC | ||
| tRNA | N/A | |
| IF1 | ||
| IF2 | ||
| IF3 | ||
| EF-G | ||
| EF-Ts | ||
| EF-Tu | ||
| aaRS | ||
| RF1/RF2 | ||
| RF4 |
Appendix 5—table 2
Expression used to estimate the association rate constants for our predictions (Table 1).
Diffusion coefficients are listed in Appendix 5—table 1.
| Factors involved in reaction | Variable | Used expression for association rate constant |
|---|---|---|
| Ternary complex and ribosome | µM−1s−1 (Dai et al., 2016) | |
| EF-G and ribosome | ||
| aaRS And tRNAs | ||
| EF-Ts and ribosome | ||
| EF-Tu and tRNAs | ||
| IF1 and 30S subunit | ||
| IF2 and 30S subunit | ||
| IF3 and 30S subunit | ||
| 50S and 30S subunits | ||
| RF1/RF2 and ribosome | ||
| RF4 and ribosome |
Appendix 5—table 3
Additional parameters used to obtain numerical values for predictions.
For the doubling times (growth rates) and tRNA to ribosome ratios used for in individual growth conditions considered, see Supplementary files 2 and 4. is taken from Klumpp et al., 2013, from Dai et al., 2016, and the tRNA/ribosome ratios from Dong et al., 1996.
| Parameter | Value | Description |
|---|---|---|
| 2.6 ± 0.5 M | In-protein amino acid concentration in the cell. | |
| (5.5 ± 0.6) × 10−4 s−1 | Average fast growth, see Supplementary file 1. | |
| 200 ± 10 | Average number of codons per protein (Equation 16). | |
| 20 ± 2 | Rescaling factor in elongation model (see Equation 26). | |
| 22 ± 2 s−1 | Maximal translation elongation rate. | |
| 1.05 ± 0.01 | Factor in three stop codon model (see Equation 23) | |
| tRNA/ribosome | 6.5 to 11 | Values taken listed in Supplementary files 2 and 4. |
| Total tRNA abundance, estimated from tRNA/ribosome. |
Additional files
-
Supplementary file 1
Proteome synthesis fraction (in %) of core mRNA translation factors for species and growth conditions with fast growth estimated from ribosome profiling data (Li et al., 2014; Lalanne et al., 2018).
- https://cdn.elifesciences.org/articles/69222/elife-69222-supp1-v2.xlsx
-
Supplementary file 2
Diffusion-limited optima predicted for translation factors for fast-growth conditions.
- https://cdn.elifesciences.org/articles/69222/elife-69222-supp2-v2.xlsx
-
Supplementary file 3
Proteome synthesis fraction (in %) of core mRNA translation factors for species/conditions with slower growth estimated from ribosome profiling.
Ribosome profiling data: E. coli (MOPS minimal [Li et al., 2014], M9 glucose [Mori et al., 2021], C. crescentus [Schrader et al., 2014], with synthesis rates estimated in Lalanne et al., 2018).
- https://cdn.elifesciences.org/articles/69222/elife-69222-supp3-v2.xlsx
-
Supplementary file 4
Diffusion-limited optima predicted for translation factors for slower growth conditions.
- https://cdn.elifesciences.org/articles/69222/elife-69222-supp4-v2.xlsx
-
Transparent reporting form
- https://cdn.elifesciences.org/articles/69222/elife-69222-transrepform-v2.pdf
Download links
A two-part list of links to download the article, or parts of the article, in various formats.
Downloads (link to download the article as PDF)
Open citations (links to open the citations from this article in various online reference manager services)
Cite this article (links to download the citations from this article in formats compatible with various reference manager tools)
First-principles model of optimal translation factors stoichiometry
eLife 10:e69222.
https://doi.org/10.7554/eLife.69222






